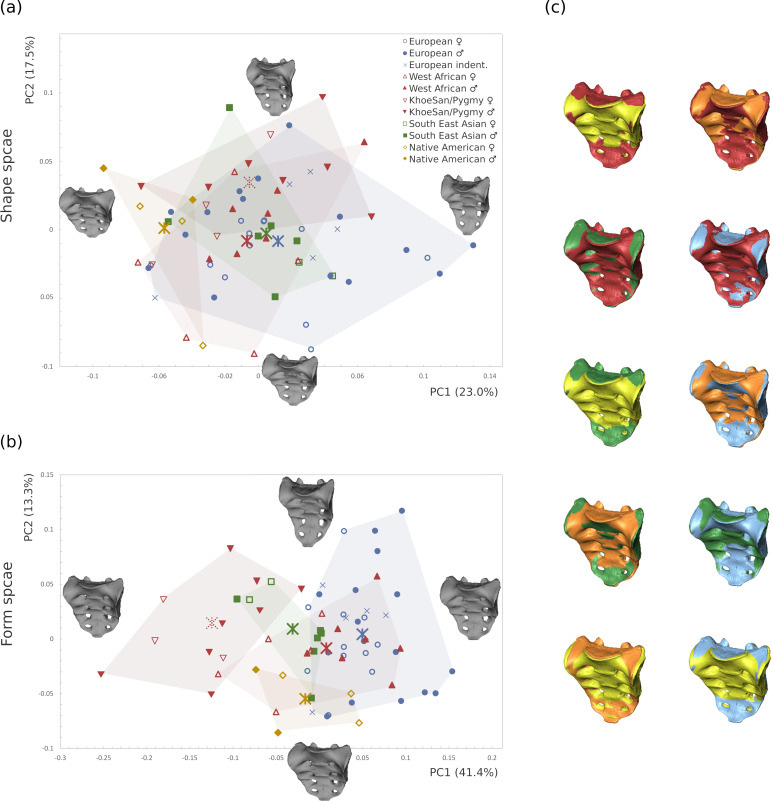
Fig 3. PCA plot of the sample without central europeans (n = 68).
The Central European specimens from the Weisbach collection were excluded to avoid overrepresentation of the European subgroup. The thin-plate-spline warps show the shapes at the extremes of the axes in (a) shape space (b) form space. (c) Pairwise comparisons between the mean shapes of the different subgroups (Europeans = blue, West Africans = red, Khoesan and Pygmies = orange, South East Asians = green, Native Americans = yellow).

