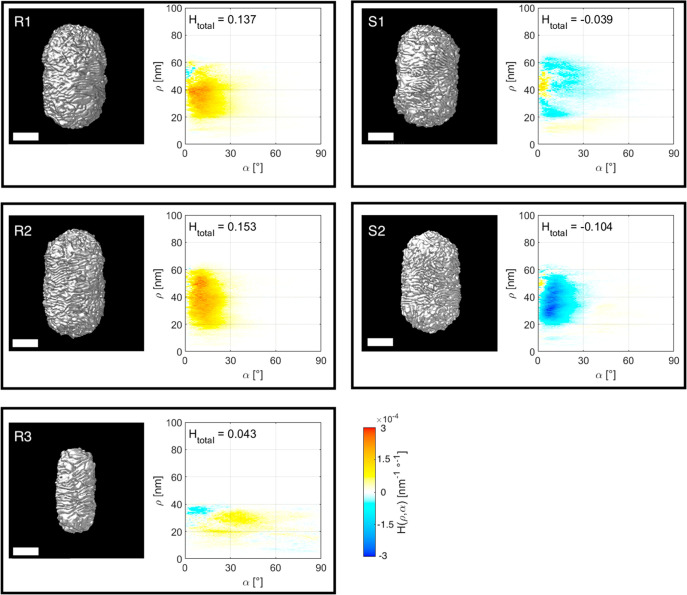
Figure 3.
Isosurface visualizations of the 3D ET reconstructions for five chiral Au NRs, described in Table 1 (left image in each panel), along with a plot of the corresponding helicity function H(ρ,α) (right image in each panel). The total helicity Htotal is also indicated for each Au NR. All scale bars are 50 nm.

