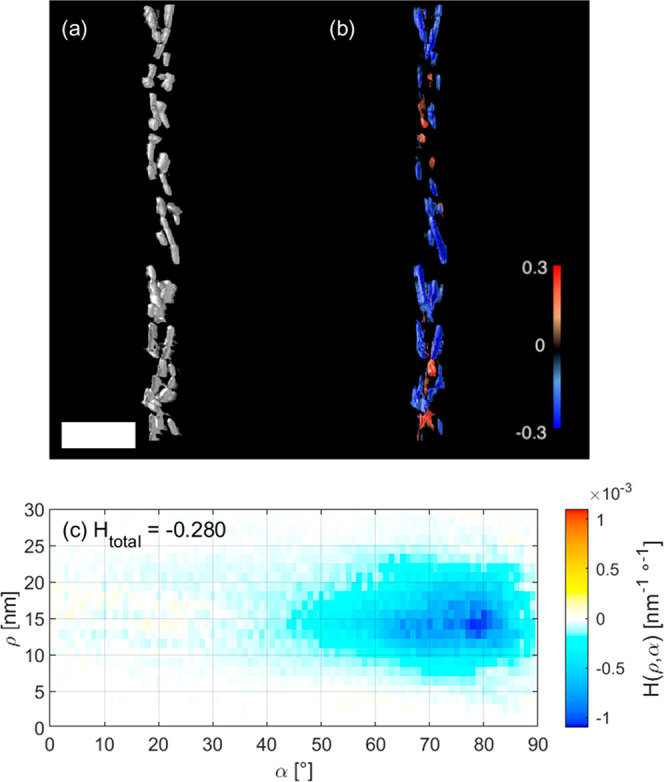
Figure 5.

Quantitative analysis of the helicity of a helical arrangement of Au NRs around an amyloid fibril. An isosurface rendering of the NRs is shown in a; the helicity map is shown in b as a semitransparent 3D color-coded volume rendering, where red indicates right-handed helicity and blue indicates left-handed helicity. The window size was chosen to encompass each individual NR. The helicity function H(ρ,α) and total helicity Htotal are given in c. The scale bar is 100 nm.
