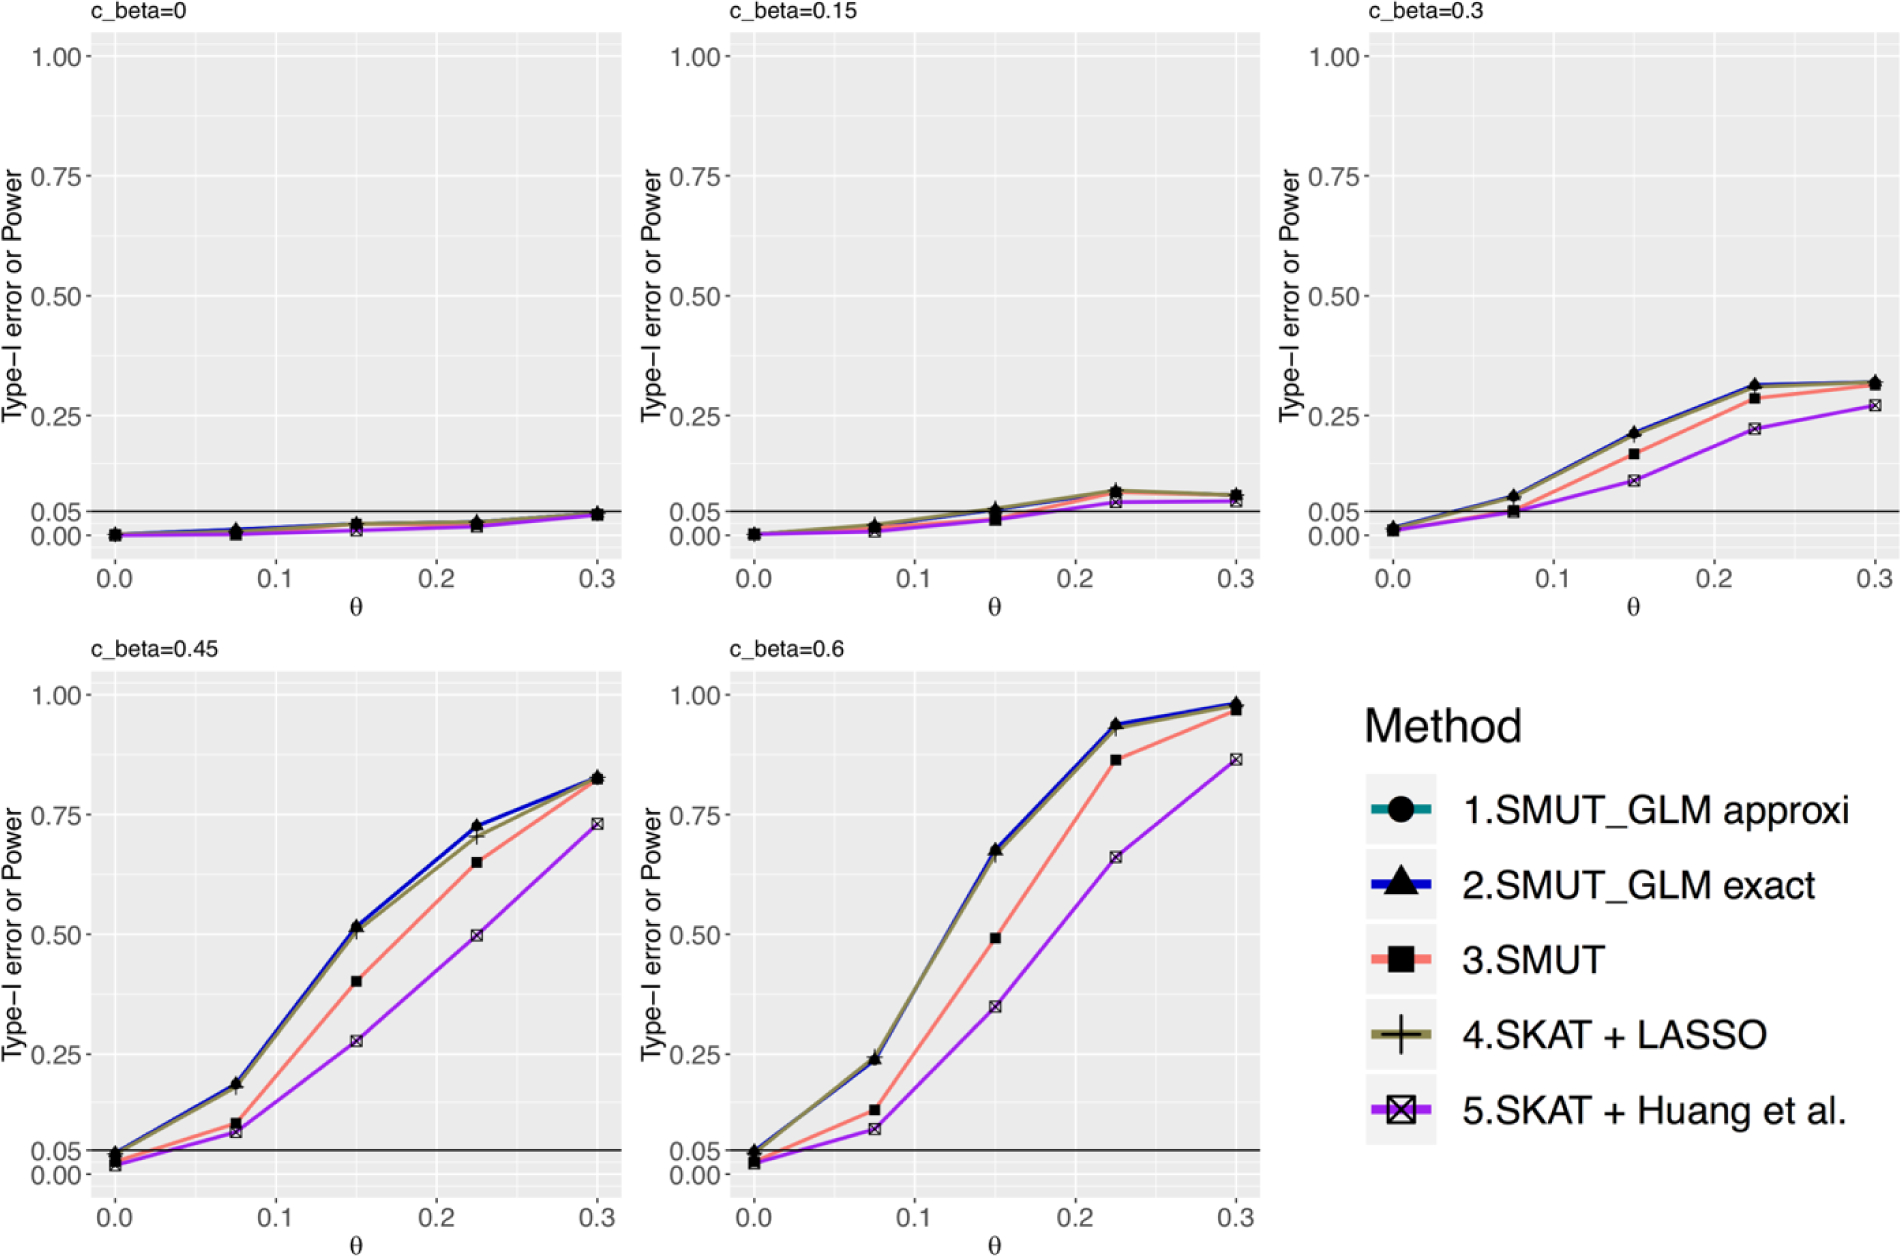
Figure 1.

For binary outcome, power and type-I error under sparse causal SNPs scenario. The x-axis is the true mediator effect (θ) on the outcome. The y-axis is the power or type-I error. Sub-figures vary in cβ value. cβ = 0 (top-left sub-figure) or θ = 0 (left-most points in each sub-figure) are null settings where y-axis represents the corresponding type-I error. When cβ ≠ 0 and θ ≠ 0, it is under alternative hypothesis and y-axis represents the corresponding power. Line for the approximated version of SMUT_GLM is overlapped with the exact version.
