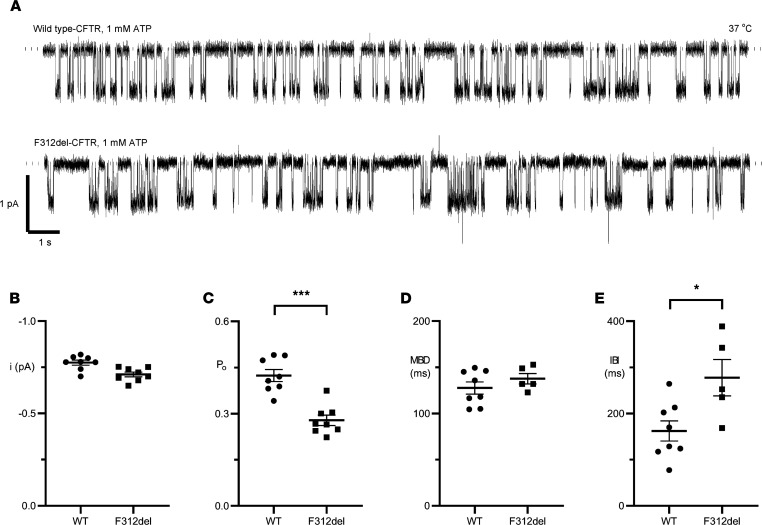
Figure 4. Single-channel behavior of WT- and F312del-CFTR.
(A) Representative recordings of WT- and F312del-CFTR chloride channels in excised inside-out membrane patches. C127 cells stably expressing WT-CFTR and CHO cells transiently transfected with CFTR cDNA containing the F312del variant were used for the study. Cells were incubated at 37°C for 1–2 days prior to the study; for some experiments with F312del-CFTR, cells were then incubated at 27°C. The recordings were acquired at 37°C in the presence of ATP (1 mM) and PKA (75 nM) in the intracellular solution. Dotted lines indicate where channels are closed and downward deflections correspond to channel openings. A large chloride concentration gradient was imposed across membrane patches ([Cl–]int, 147 mM; [Cl–]ext, 10 mM) and membrane voltage was clamped at –50 mV. (B–E) Plots show i, Po, MBD, and IBI of WT- and F312del-CFTR. Data are means ± SEM (WT, n = 8; F312del, B and C, n = 8; and F312del, D and E, n = 5); ***P < 0.001 and *P < 0.05 versus WT-CFTR calculated using Student’s t test. For WT-CFTR, the number of active channels (N) per membrane patch = 1. For F312del-CFTR, n = 2–5 (n = 2 [2 membrane patches]; n = 3 [2 membrane patches], and n = 5 [4 membrane patches]). In 3 F312del-CFTR recordings, burst analysis was not possible because either too few bursts were acquired or the recordings were too noisy.

