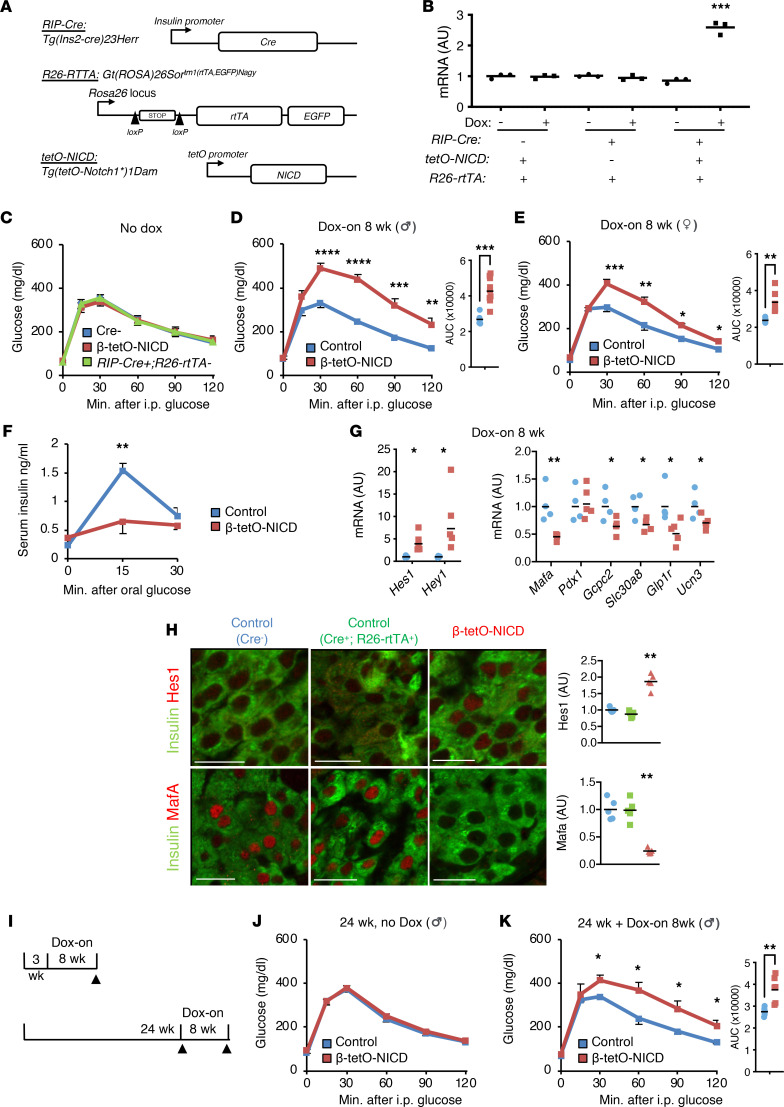
Figure 1. β Cell Notch activation induces glucose intolerance and loss of β cell maturity.
(A) Generation of β-tetO-NICD mice. (B) Hes1 expression in islets that were cultured overnight in the presence or absence of 1 μg/mL doxycycline (Dox). n = 3 mice per genotype. (C) Glucose tolerance test (GTT) in 8-week-old Cre–, β-tetO-NICD, and Cre+ Rosa26-rtTA– mice, prior to Dox exposure (n = 6–7 mice/group). AUC, area under the curve (mg × dL/min). (D) GTT in male and (E) female β-tetO-NICD and Cre– controls after 8 weeks’ Dox (n = 7–9 mice/group). (F) Serum insulin after oral glucose challenge in male β-tetO-NICD and Cre– controls, after 8 weeks’ Dox (n = 5 mice/group). (G) Gene expression in islets isolated from β-tetO-NICD and Cre– mice after 8 weeks’ Dox. Notch targets (left) and β cell maturity genes (right) (n = 4–5 mice/group). (H) Representative images of pancreatic sections from Cre– and Cre+ Rosa26-rtTA+ tetO-NICD– control and β-tetO-NICD mice after 8 weeks’ Dox, with antibodies directed against Hes1 (top) or Mafa (bottom) and insulin, with quantitation of β cell nuclear Hes1 and Mafa fluorescence intensity (n = 5 mice/group). Scale bars: 20 μm. (I) Experimental schematic used in Dox-on at weaning (top) or in older mice (bottom). (J and K) GTT in 24-week-old control and β-tetO-NICD males prior to (J) or after (K) Dox (n = 5–6 mice/group). All data are shown with group means ± SEM; *, P < 0.05, **, P < 0.01, ***, P < 0.001, ****, P < 0.0001 by 2-tailed t test.

