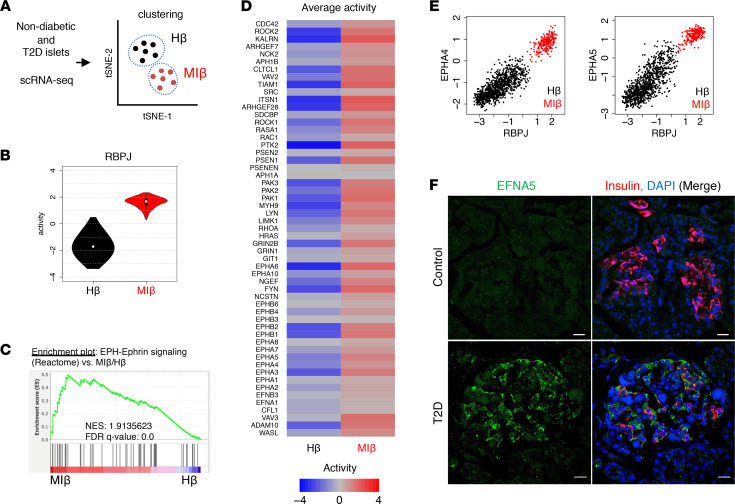
Figure 7. Increased Notch and Ephrin signaling in metabolically inflexible human β cells.
(A) scRNA-Seq of islets from nondiabetic and T2D patients, with β cells subclustered by metabolic pathways to define healthy (Hβ) and metabolically inflexible (MIβ) as per a previous report (48). tSNE, t-distributed stochastic neighbor embedding. (B) Violin plots of RBPJ activity in Hβ and MIβ cell populations. (C) GSEA of EPH-Ephrin signaling in DEGs of MIβ versus Hβ populations. NES, normalized enrichment score. (D) Average activity of EPH-Ephrin signaling components in Hβ and MIβ populations. (E) RBPJ activity as compared with EPH-Ephrin signaling components, with each dot representing a single Hβ (black) and MIβ (red) cell. Extended figure with all EPH-Ephrin signaling components and Pearson’s r values in Supplemental Figure 11A. (F) Representative images of pancreatic sections stained with antibodies against EFNA5 and insulin from nondiabetic and T2D patients. Extended figure with additional staining in Supplemental Figure 12B. Scale bars: 20 μm.

