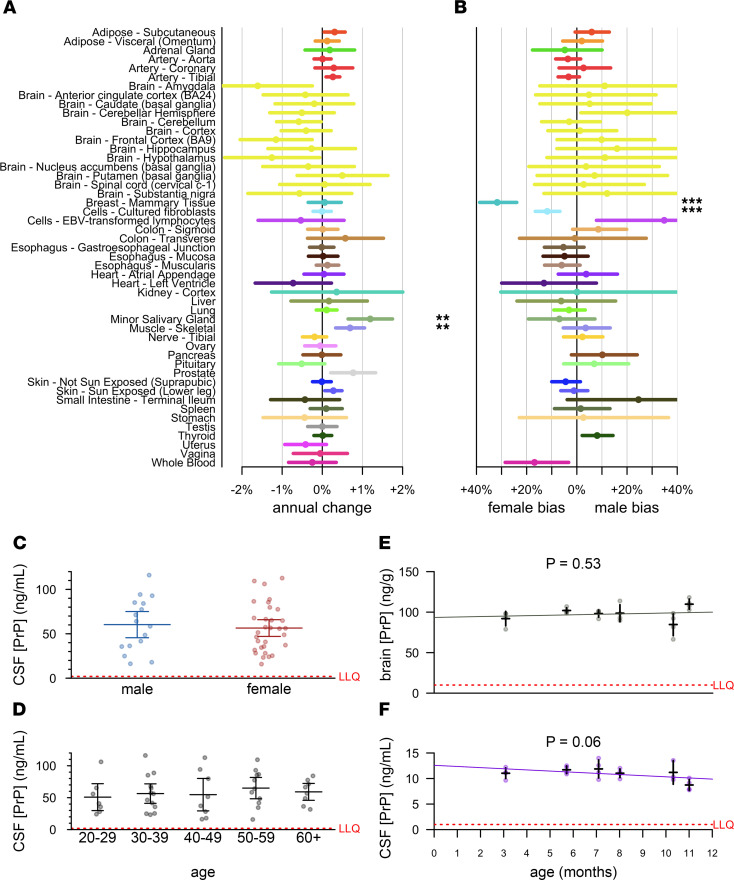
Figure 2. Lack of evidence for sex or age effects in PrP expression.
(A and B) Analysis of publicly available GTEx v8 data. Log-linear models [log(tpm) ~ age + hardy + sex; see Results] were fit for each tissue, and the mean annual change (dots) was calculated as exp(βage)-1 and exp(βsex), with 95% confidence intervals (line segments) given by 1.96 standard errors of the mean. After Bonferroni correction for n = 49 tests (A) or n = 44 tests (B), symbols indicate *P < 0.05, **P < 0.01, ***P < 0.001. (C and D) CSF PrP concentrations averaged across all available CSF samples for n = 47 MGH study participants stratified by sex (C) or age (D). Bars indicate mean and 95% confidence interval of the mean. (E and F) Brain (E) and CSF (F) concentrations of PrP for cohorts of n = 4 male Sprague-Dawley rats aged 3–11 months. Red dashed lines indicate lower limit of quantification (LLQ).

