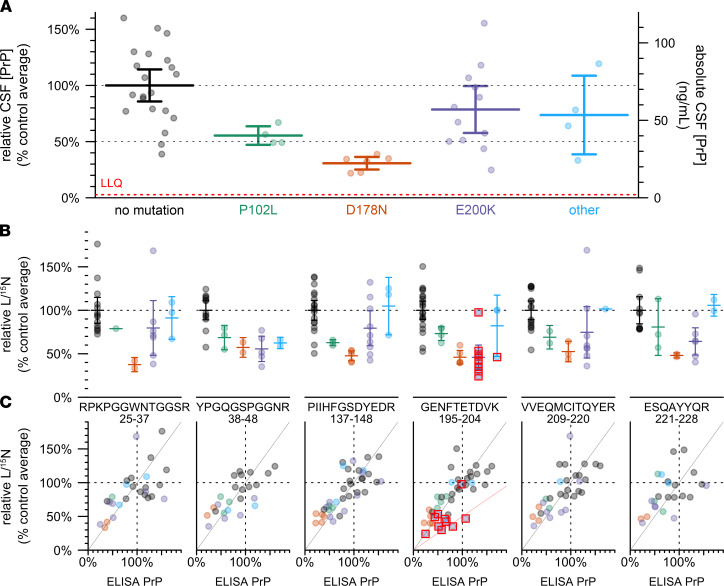
Figure 3. Effect of PRNP mutation on CSF PrP concentration.
(A) CSF PrP concentrations measured by cross-species ELISA, averaged across all available CSF samples for each of n = 47 MGH study participants, normalized to the mean of non-mutation carrier controls. Bars indicate mean and 95% confidence interval of the mean. Red dashed line indicates lower limit of quantification (LLQ). This sample set includes n = 29 individuals for which CSF PrP concentrations determined by BetaPrion ELISA were previously reported (11). (B) The same samples analyzed by the PrP MRM assay, peptides arranged from N-terminal (left) to C-terminal (right). Peptide sequences and residue numbers are noted beneath each plot. Because observations with technical replicate CVs greater than 15%, were removed, the number of samples differs for each panel. Bars indicate mean and 95% confidence interval of the mean. (C) Correlation between ELISA results from (A) (x axis) and MRM results from (B) (y axis), with lines indicating a diagonal with slope = 1 (gray) and 0.5 (pink, GENFTETDVK only). In (B and C), red boxes indicate individuals whose mutation abolishes the tryptic peptide being monitored in that plot.

