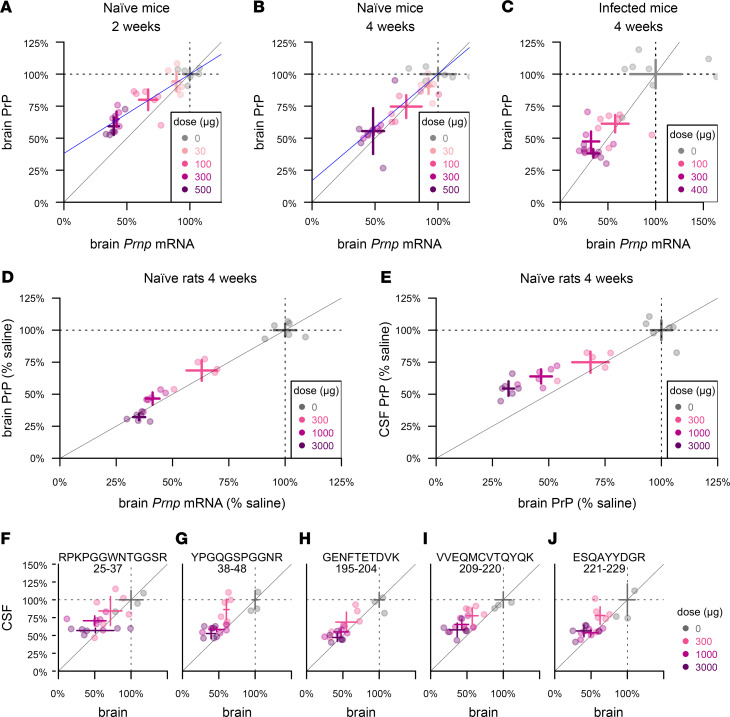
Figure 4. Pharmacodynamic effect of PrP RNA-targeting therapy.
(A and B) Whole-hemisphere RNA (x axis) versus PrP (y axis), reduction measured by ELISA in groups of n = 6 naive mice at 2 weeks (A) and 4 weeks (B) after dosing. Blue lines represent linear regression best fits with the (1,1) coordinate fixed. (C) RNA from the lateral half of 1 hemisphere (x axis) versus PrP from the medial half of the same hemisphere (y axis), reduction measured by ELISA in groups of n = 6 RML prion–infected mice dosed at 60 dpi and harvested at 4 weeks after dosing. (D) Whole-hemisphere RNA (x axis) versus PrP (y axis), reduction measured by ELISA in groups of n = 6 naive rats harvested at 4 weeks after dosing. (E) Whole hemisphere PrP (x axis) reduction versus CSF PrP (y axis) in the same rats. (F–J) CSF and brain samples from (E) analyzed by MRM, with the 5 rat PrP peptides arranged from N-terminal (F) to C-terminal (J). Peptide sequences and residue numbers are noted above each plot. In every panel, crosshairs represent the mean and 95% confidence interval of the mean on both dimensions.

