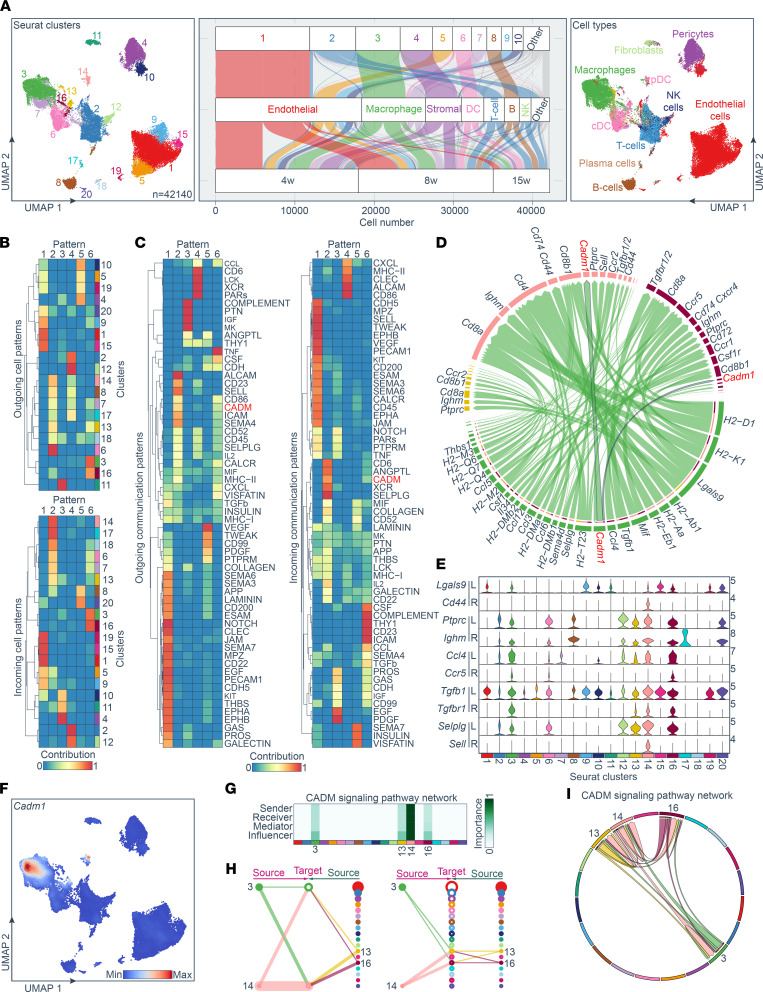
Figure 1. Evidence of Cadm1-mediated intercellular interaction within myeloid cell populations during autoimmune diabetes pathogenesis in mice.
(A) UMAP and graph-based clustering of pancreatic islet immune cells from NOD mice between ages 4 and 15 weeks. The UMAP plot revealed cellular heterogeneity with 20 distinct clusters identified and color-coded. The general identity of each cluster was predicted by SingleR using the ImmGen database (right). The Sankey plot (middle) simultaneously defined the cellular identity for each cluster and time point. (B) Inferred outgoing (upper) and incoming (lower) communication patterns of secreting and target cells, which show correspondence between the inferred latent patterns and clusters and (C) the identified signaling pathways. (D) The chord diagram shows key macrophage communication pathways. The diagram links ligand-receptor pairs, which are grouped for cell type and cluster (colored outer arcs). Cadm1 is highlighted in red. (E) Violin plots showing distribution of established ligand-receptor gene pairs involved in the inferred signaling networks mediated by myeloid cells. (F) Feature plot of Cadm1 distribution. Expression level for each cell are color-coded and overlaid onto a UMAP plot. (G) Heatmap shows the relative importance of cell groups based on the computed 4 network centrality measures of the CADM signaling network. (H) Hierarchical plot showing inferred intercellular communication network for CADM signaling. Left and right portions highlight autocrine and paracrine signaling between myeloid cell states, respectively. Solid and open circles represent source and target, respectively. Circle sizes are proportional to cell numbers in each group and edge width represents the communication probability. Edge colors are consistent with the signaling source. Cluster 3: macrophage; cluster 13: macrophage; cluster 14: DC; and cluster 16: macrophage. (I) Chord diagram shows CADM-signaling communication pathways used by different cell types. The links start from a ligand and end in a receptor, which are grouped for each cluster (colored outer arcs). pDC, plasmacytoid DC.

