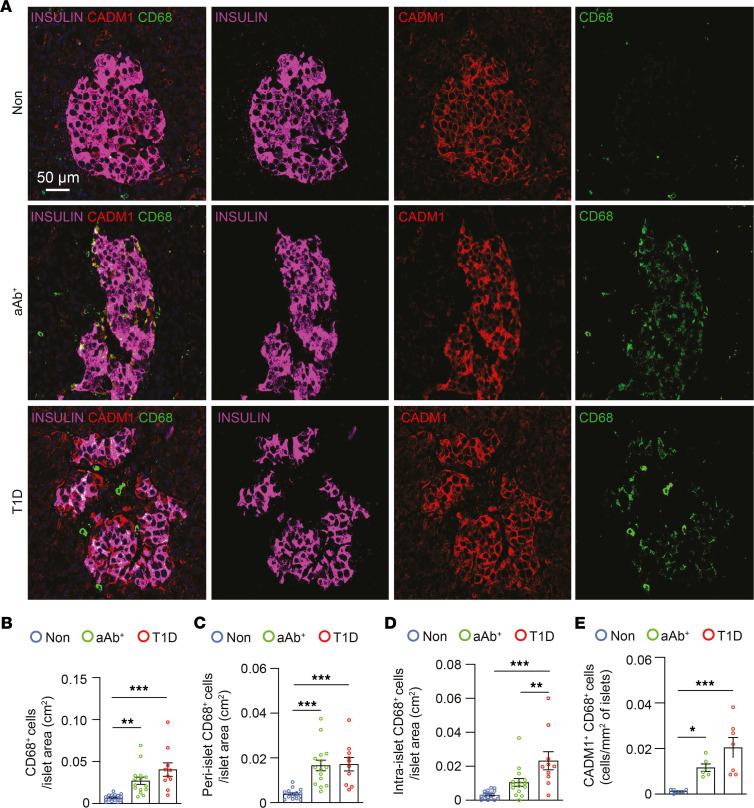
Figure 4. Increased number of CD68+ cells adjacent to CADM1+insulin+ cells during T1D.
(A) Immunostaining of paraffin-embedded pancreata from individuals in the Non, aAb+, and T1D groups for CADM1 (red), CD68 (green), and insulin (magenta). Scale bar: 50 μm. (B) Quantification of the number of CD68+ cells within the islet boundary (n = 5 per group). (C) Quantification of the number of CD68+ cells at the islet periphery per islet area (n = 5 per group). (D) Quantification of the number of CD68+ cells within the islet boundary (n = 5 per group). (E) Quantification of the number of CADM1+CD68+ cells within the islet boundary (n = 5 per group). One-way ANOVA was performed using GraphPad Prism, version 7, software for comparisons of 3 groups. Post hoc statistical analyses were performed using Tukey’s multiple comparisons test. Results are presented as mean ± SEM. *P < 0.05; **P < 0.01; ***P < 0.001.

