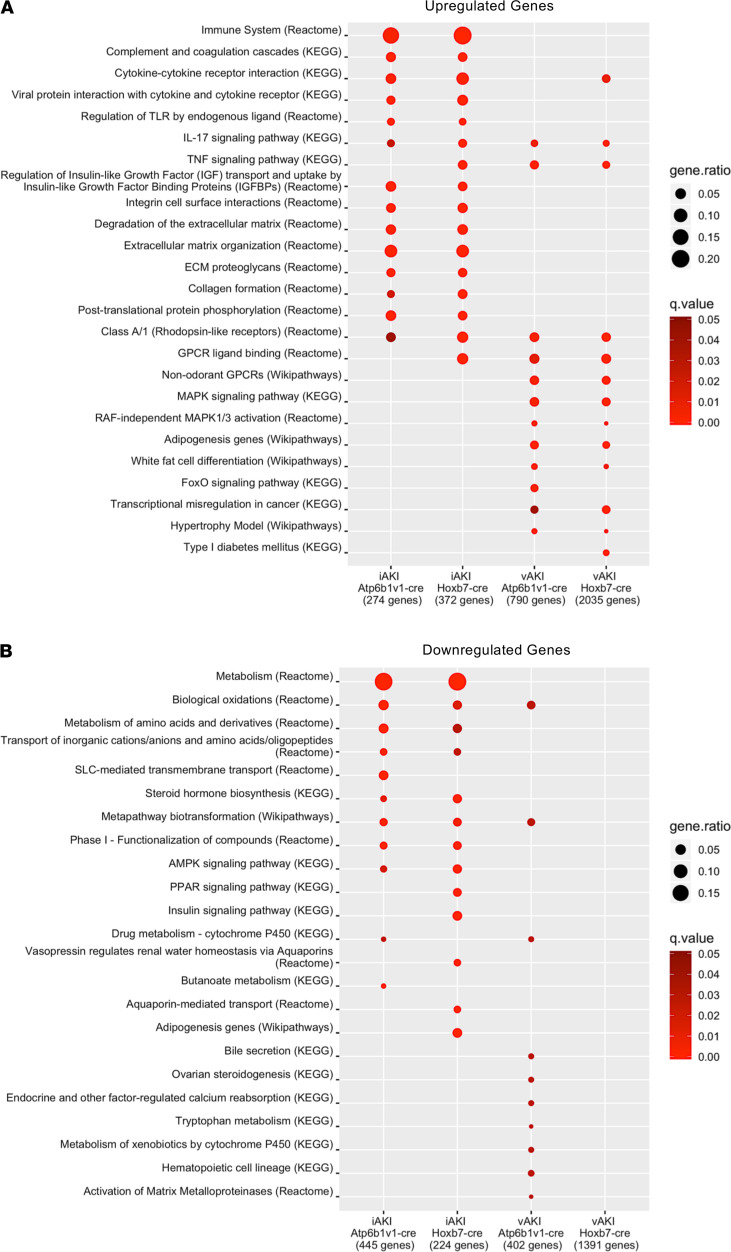
Figure 6. Pathway overrepresentation analysis.
Enrichment of pathways in (A) significant upregulated DEGs (padj < 0.05; log2 fold change ≥ 1) and (B) significant downregulated DEGs (padj < 0.05; log2 fold change ≤ 1) from each RNA pool. Red color represents –log10 q value restricted to q < 0.05. Note the relatedness of pathways uniquely activated by ischemia or by volume depletion.

