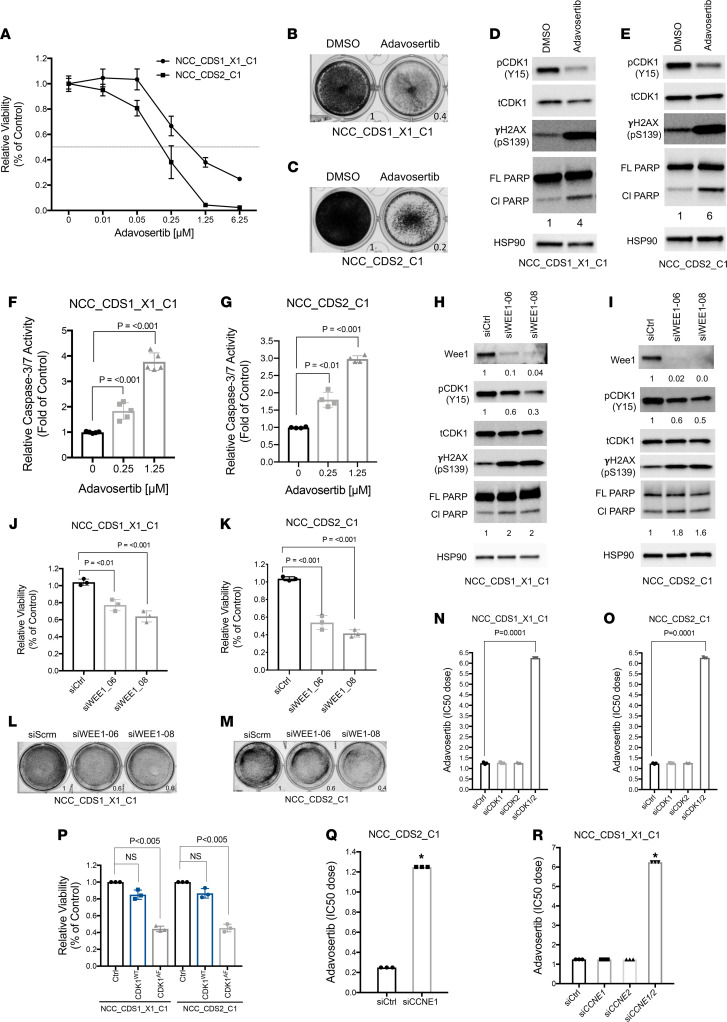
Figure 2. CIC-DUX4 sarcomas depend on WEE1 for survival.
(A) CTG viability assay of NCC_CDS1_X1_C1 and NCC_CDS2_C1 cells treated with adavosertib. Error bars represent SEM; performed in duplicate. Crystal violet assay of NCC_CDS1_X1_C1 (B) and NCC_CDS2_C1 (C) cells comparing adavosertib (IC50 dose) and DMSO control. (D) Immunoblot analysis of NCC_CDS1_X1_C1 cells treated with adavosertib or DMSO control. Representative figure; performed in duplicate. Lysates were run on parallel gels. FL, full-length; Cl, cleaved. (E) Immunoblot analysis of NCC_CDS2_C1 cells treated with adavosertib or DMSO control. Representative figure; performed in duplicate. (F and G) Relative caspase-3/7 activity in NCC_CDS1_X1_C1 and NCC_CDS2_C1 cells treated with adavosertib versus control. One-way ANOVA; performed in triplicate. (H and I) Immunoblot analysis of NCC_CDS1_X1_C1 and NCC_CDS2_C1 cells expressing 2 independent WEE1 siRNAs. Representative figure; performed in duplicate. (J and K) CTG viability assay comparing 2 independent WEE1 siRNAs with scramble control in NCC_CDS1_X1_C1 and NCC_CDS2_C1 cells. One-way ANOVA; performed in triplicate. (L and M) Viability assay comparing 2 independent WEE1 siRNAs with scramble control (siScrm) in NCC_CDS1_X1_C1 and NCC_CDS2_C1 cells. One-way ANOVA; performed in duplicate. (N and O) Adavosertib IC50 dose in NCC_CDS1_X1_C1 and NCC_CDS2_C1 cells expressing siCDK1, siCDK2, or siCDK1 and siCDK2. One-way ANOVA; performed in triplicate. (P) Relative viability comparing NCC_CDS1_X1_C1 and NCC_CDS2_C1 cells expressing CDK1WT or CDK1AF versus vector control. One-way ANOVA. Error bars represent SEM; performed in triplicate. (Q) Adavosertib IC50 dose in NCC_CDS2_C1 cells expressing siCCNE1 or siCtrl. Performed in triplicate. *P <0.001, Student’s t test. (R) Adavosertib IC50 dose in NCC_CDS1_X1_C1 cells expressing siCCNE1, siCCNE2, siCCNE1, and siCCNE2 compared with siCtrl; performed in triplicate. *P <0.001, 1-way ANOVA.

