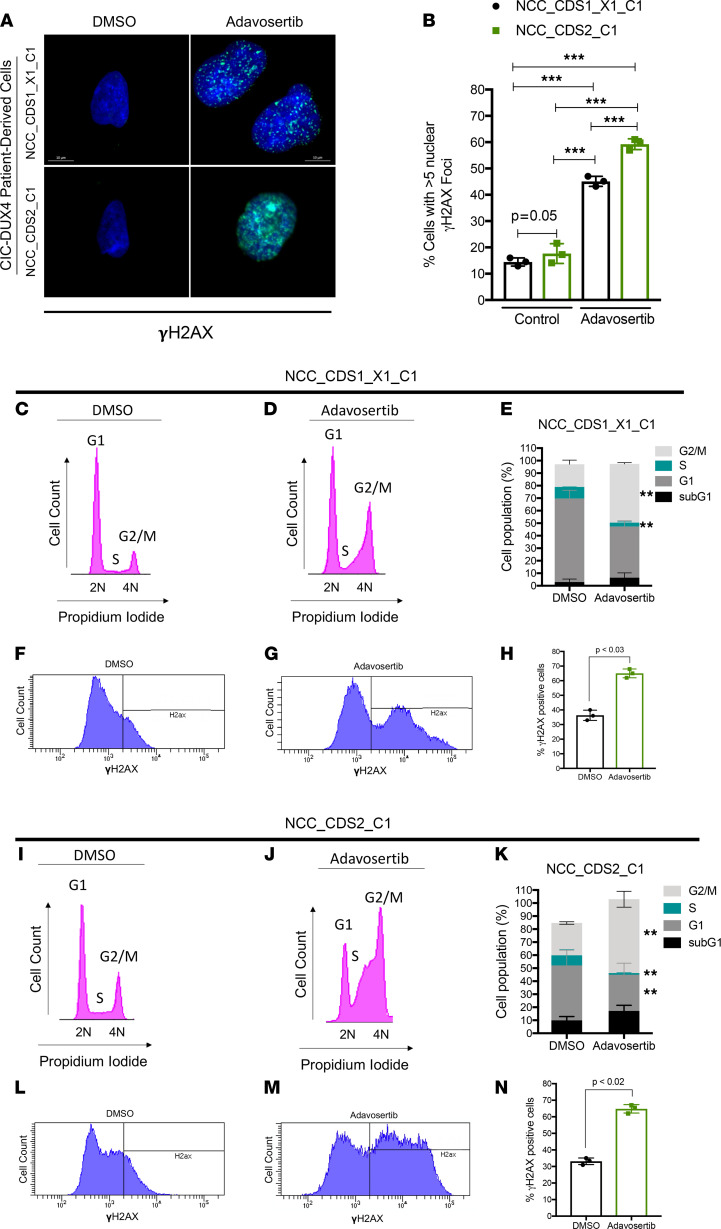
Figure 3. WEE1 inhibition increases DNA damage and mitotic entry in CIC-DUX4 sarcoma cells.
(A) γH2AX IF staining of NCC_CDS1_X1_C1 and NCC_CDS2_C1 cells treated with adavosertib (0.5 μM) or DMSO (48 hours). Representative figure; performed in triplicate. Scale bars: 10 μm. (B) Quantitative analysis of γH2AX IF in A demonstrating the percentage of NCC_CDS1_X1_C1 or NCC_CDS2_C1 cells with more than 5 nuclear γH2AX foci following treatment with adavosertib or control. Mean percentage over 10 HPFs. ***P < 0.001, 1-way ANOVA. Representative cell cycle histograms (PI staining) of NCC_CDS1_X1_C1 (C and D) and NCC_CDS2_C1 (I and J) cells treated with adavosertib or DMSO (48 hours). Percentage of adavosertib- (0.5 μM) and DMSO-treated (48 hours) NCC_CDS1_X1_C1 (E) and NCC_CDS2_C1 (K) cells in sub-G1, G1, S, and G2/M phases as identified in C, D, I, and J. **P < 0.05, 1-way ANOVA. Performed in triplicate. Error bars represent SEM. Values for each fraction of cells in sub-G1, G1, S, and G2/M are provided in Supplemental Figure 4, A and B. γH2AX expression in NCC_CDS1_X1_C1 (F and G) and NCC_CDS2_C1 (L and M) cells treated with adavosertib or DMSO. Percentage of γH2AX-positive cells among NCC_CDS1_X1_C1 (H) and NCC_CDS2_C1 (N) cells analyzed in F, G, L, and M. Student’s t test. Error bars represent SEM.

