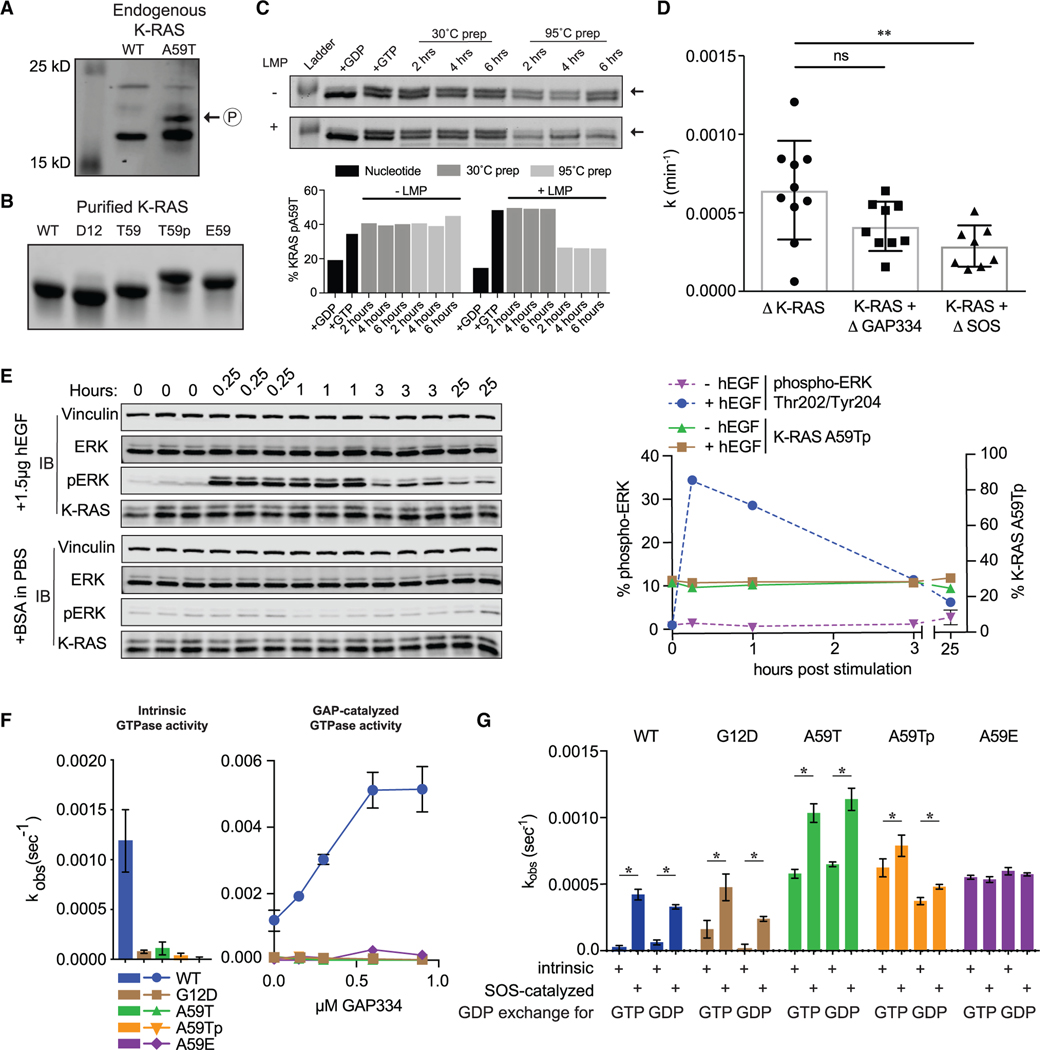
Figure 1. T59 phosphorylation alters K-RAS cycling.
(A) Western blot of K-RAS in LIM1215 (WT) and SNU-175 (A59T) cells.
(B) SDS-PAGE of purified K-RAS with different residues at position 59.
(C) K-RASA59T incubated in the presence of GDP (lane 2) or GTP (lane 3). Dephosphorylation of K-RASA59T incubated with GTP with or without lambda phosphatase (LMP) for different times at 30°C after pre-incubation of protein at 30°C (lanes 4–6) or 95°C (lanes 7–9). Band quantification is shown below.
(D) Summary of K-RASA59T autophosphorylation kinetics alone or with regulatory proteins. Autophosphorylation rate constants (k) were calculated as v•[E0]−1.
(E) Serum-starved and hEGF-stimulated SNU-175 cells showing phosphorylated ERK1/2 (pERK) or K-RAS. Replicates are labeled above the gel. Band quantification was normalized to the average “0” replicate and is shown on the right.
(F) Intrinsic and GAP-catalyzed hydrolysis (k) for K-RAS and mutants. Each bar or data point represents the average k (n = 3–4).
(G) Exchange of GDP-loaded K-RAS4B for mant-GTP or mant-GDP (n = 3–4).
* denotes p < 0.05 and ** denotes p < 0.005 by Student’s t test. Error bars represent ± SD.

