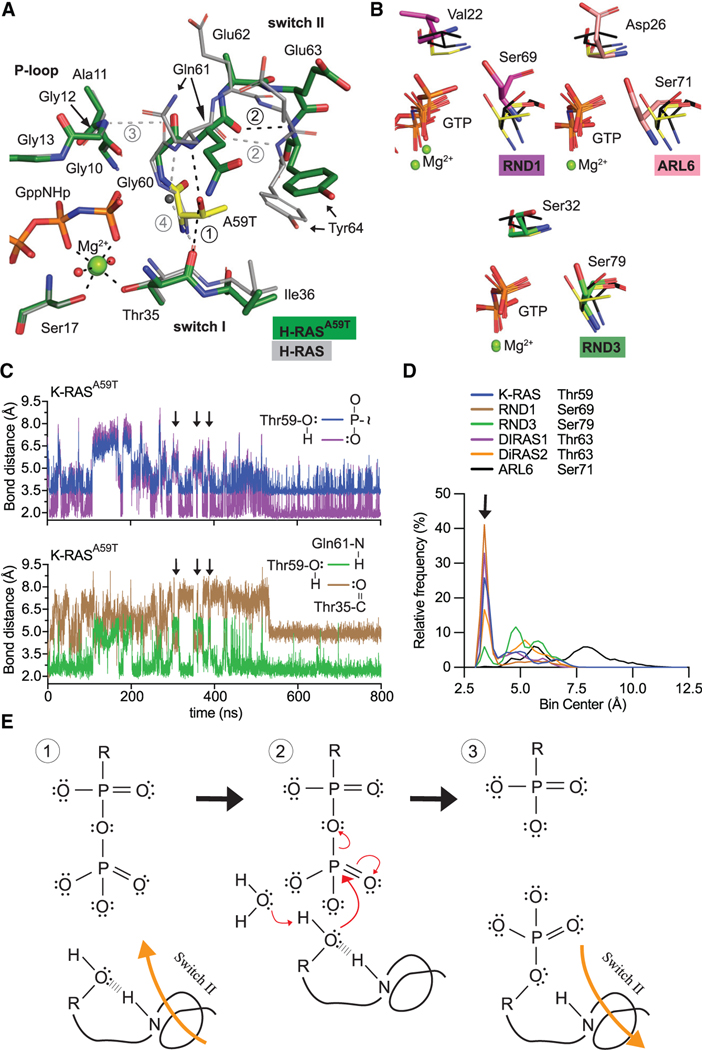
Figure 2. Conserved mechanism of autophosphorylation in GTPases.
(A) Active site comparison of H-RASA59T crystal 1 (green) and WT H-RAS (PDB: 3K8Y, gray). Black and gray dashed lines are H-bonds made in H-RASA59T and WT structures. Thr59 is shown in yellow.
(B) Active site similarities between H-RASA59T and other small GTPases. Black sticks are from the H-RASG12V/A59T structure (PDB: 521P) with an alternate Thr59 orientation.
(C) Bond distances made during simulation of K-RASA59T bound to GTP. Inset on the right shows measured bonds.
(D) Frequency distribution of nucleophile to γ-phosphate distances from MD simulations.
(E) Proposed mechanism of autophosphorylation. The N-H group of switch II represents the backbone carbonyl of Gln61.

