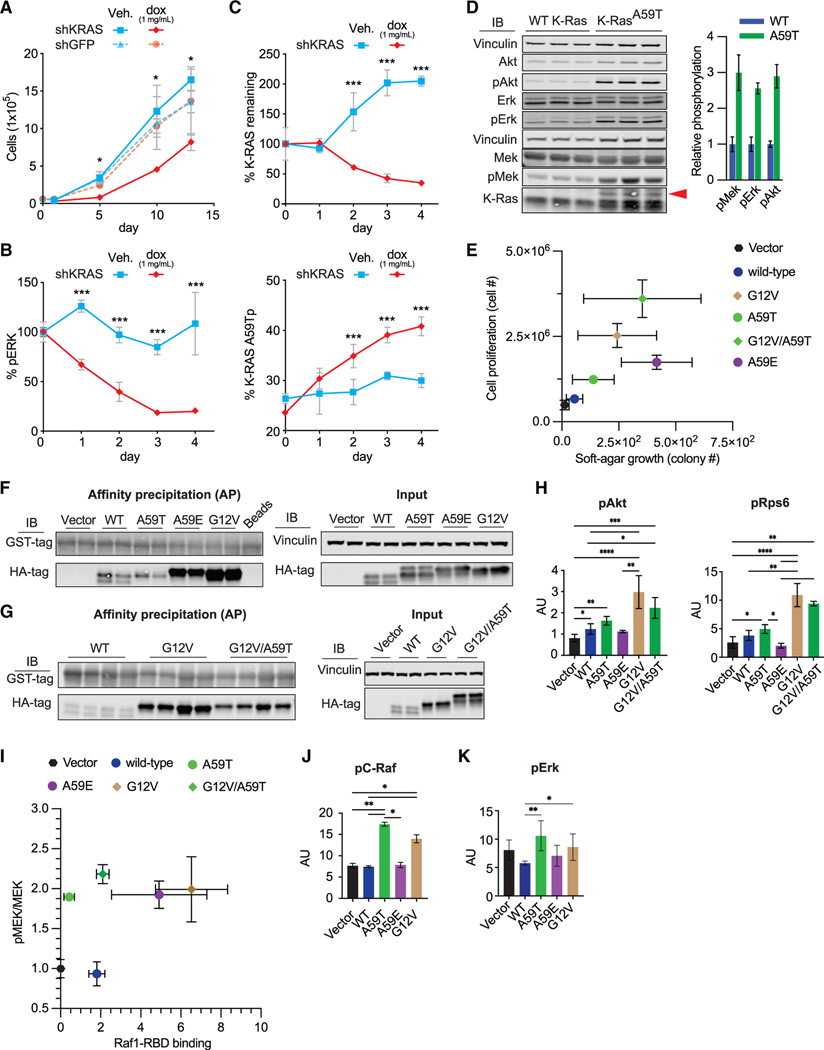
Figure 4. Roles of K-RASA59T and K-RASA59E in cellular transformation.
(A) Effect of KRAS shRNA on proliferation in SNU-175 cells (n = 2–3).
(B) Effect of KRAS shRNA on ERK1/2 phosphorylation in SNU-175 cells (n = 2–3). Data are normalized to the average ERK1/2 phosphorylation on day 0.
(C) Effect of KRAS shRNA on K-RAS expression and autophosphorylation in SNU-175 cells (n = 2–3). Data are normalized to the average K-RAS expression on day 0 (upper).
(D) Baseline phosphorylation of Mek, Erk, and Akt in WT and K-RasA59T mouse embryonic stem cells after 6 h of serum starvation. The red arrow denotes autophosphorylated K-RAS. Quantification is shown on the right and normalized to average phosphorylation for WT cells.
(E) Growth of NIH3t3 cells with ectopic K-RAS on plastic (x axis, n = 4–5) and in soft agar (y axis, n = 3) in 10% serum.
(F and G) Representative western blots from precipitation of GTP-bound K-RAS from NIH3t3 cells (F and G) by C-RAF-RBD-GST. Note that the upper band representing K-RAST59p is absent.
(H) Quantification of Akt (Ser473) and Rps6 (Ser235/236) phosphorylation (n = 4).
(I) Comparison of Mek phosphorylation (x axis, n = 4) and K-RAS-GTP (y axis, n = 4). Phosphorylated was normalized to total Mek. K-RAS-GTP was scaled to protein input and normalized to the average in cells expressing WT K-RAS.
(J) Quantification of C-Raf phosphorylation on Ser289/296/301 (n = 4).
(K) Quantification of Erk1/2 phosphorylation on Thr202/Tyr204 (n = 4).
In (A–C), errors bars represent ± SD and statistical analyses used Student’s t test. For (H–K), errors bars represent ± SD and statistical analyses were performed with Mann-Whitney test. *, **, and *** represent P values of < 0.05, < 0.005, and < 0.0005, respectively. In (E–K), statistical comparisons and representative western blots are in Figure S4.

