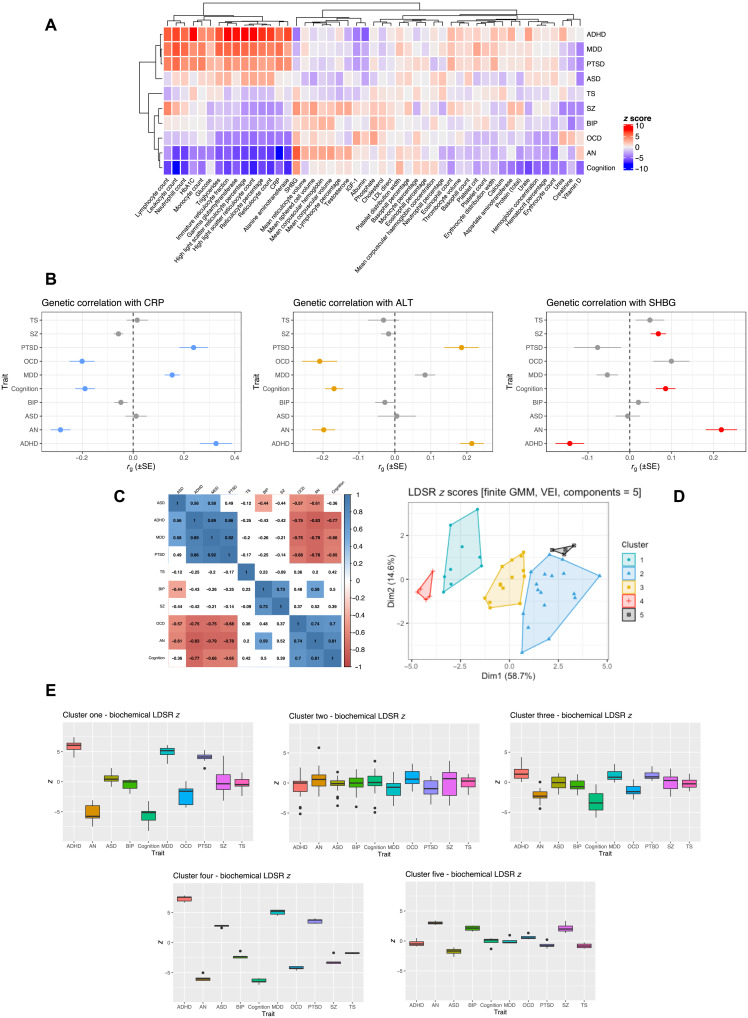
Fig. 1. Genetic correlation between blood-based biomarkers and psychiatric GWAS.
(A) Heatmap of LDSR correlation z scores (rg/SE) between each psychiatric trait and 49 biochemical GWAS. The psychiatric and biochemical traits are grouped on the x and y axes, respectively, by hierachial clustering using Pearson’s distance. (B) Examples of biochemical traits with evidence of discordant genetic correlations among the different psychiatric phenotypes. CRP, alanine aminotransferase (ALT), and sex hormone binding globulin (SHBG) are presented for illustration. The forest plot denotes the LDSR rg, with its SE representing the confidence bars. Traits highlighted in blue, orange, and red for CRP, ALT, and SHBG, respectively, were significantly correlated after the application of multiple testing correction. (C) Correlation matrix (Pearson) of LDSR z score between each trait, correlation estimates that survive correction for the number of tests performed are highlighted. (D) Components of biochemical LDSR z scores derived using finite Gaussian mixture modeling (GMM)—the optimal parametrization of the variance-covariance matrix was five components with diagonal distribution, variable volume, and equal shape (VEI). The components are plotted relative to their contribution to the first and second principal components of the LDSR z score matrix. (E) Box-and-whisker plots of the LDSR z scores for each disorder composed of traits assigned to each of the five components derived from the GMM procedure.

