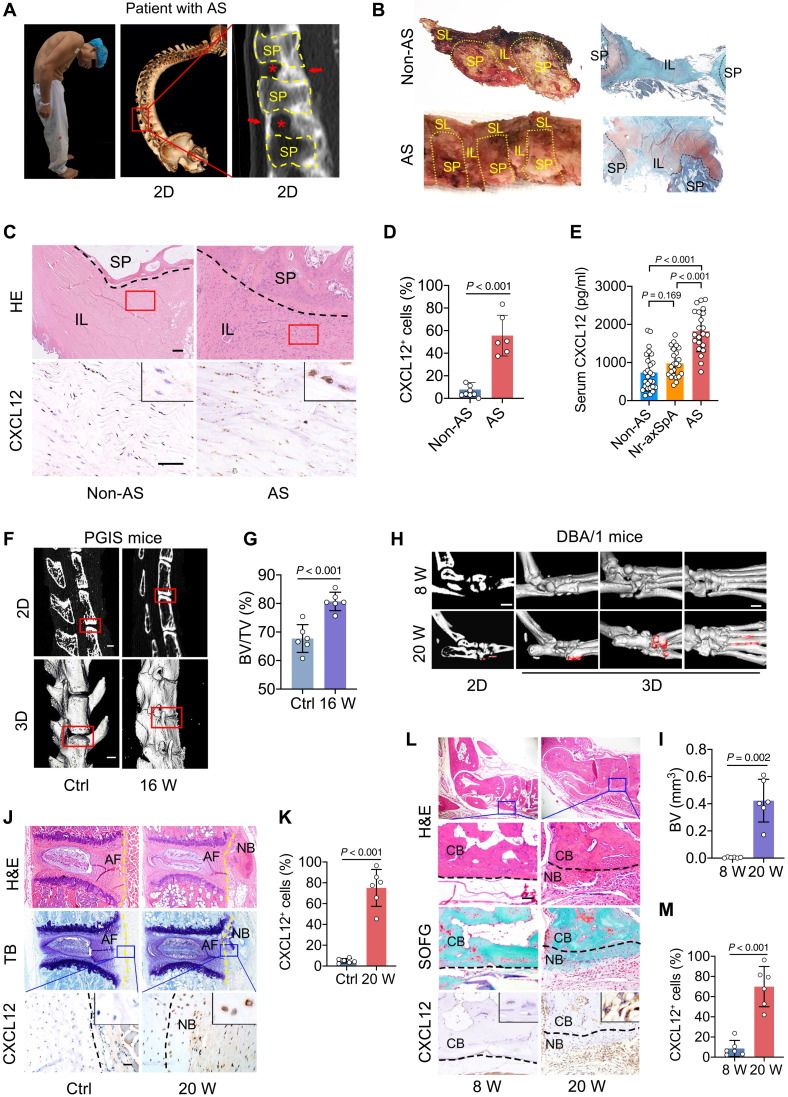
Fig. 1. CXCL12 is up-regulated in spinal ligament tissues from patients with AS and animal models.
(A) Illustration of human spinal ligament tissue collection. Red arrows indicate pathological new bone. Red asterisks indicate uncalcified ligaments, the potential pathological new bone formation sites, that are used for further analysis. 2D, two dimensional. (B) Schematic diagram of the anatomy of the spinal ligament. (C and D) Hematoxylin and eosin (H&E) staining, immunohistochemical staining, and quantitative analysis of CXCL12 in spinal ligament from patients with AS and non-AS patients. Scale bars, 200 μm. (E) Peripheral serum concentration of CXCL12 of non-AS (n = 27), non-radiographic axial spondyloarthritis (Nr-axSpA) (n = 23), and patients with AS (n = 22). Analysis of variance (ANOVA; F2,69 = 34.69) with Tukey’s post hoc test was used. (F and G) Micro–computed tomography (μCT) images and quantitative analysis of lumber spine of PGIS mice. Scale bars, 500 μm. (H and I) μCT images and quantitative analysis of hind paw of DBA/1 mice at the age of 8 and 20 weeks (W). Scale bars, 1 mm. (J and K) H&E staining, TB staining, immunohistochemical staining, and quantitative analysis of CXCL12 in lumber spine of PGIS mice. Scale bar, 200 μm. (L and M) H&E staining, Safranin O and Fast Green (SOFG) staining, immunohistochemical staining, and quantitative analysis of CXCL12 in hind paws of male DBA/1 model. Scale bar, 200 μm. Each dot represents the mean value of three technical replicates. n = 6 tissues from six patients with AS versus n = 8 tissues from eight non-AS patients in (A to D). n = 6 tissues from six mice for each group in (C to L). Data are shown as means ± SEM. Student’s t test with Shapiro-Wilk test was used unless specifically mentioned. CB, cortical bone; NB, new bone; SP, spinous process; IL, interspinous ligament; SL, supraspinous ligament; BV, bone volume; TV, total volume; TB, toluidine blue.

