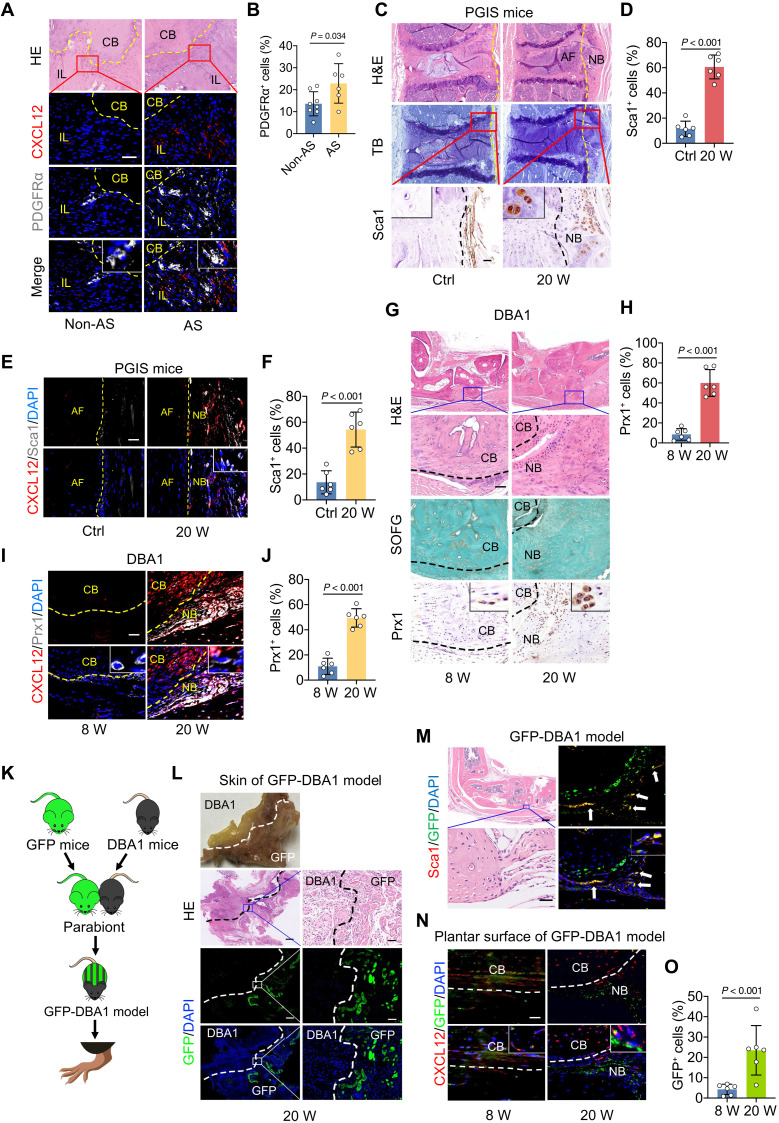
Fig. 2. CXCL12/CXCR4 induces migration of OPCs.
(A and B) Immunofluorescence staining and quantitative analysis of PDGFRα in spinal tissues from patients with AS or non-AS. Scale bar, 100 μm. n = 6 tissues from patients with AS versus n = 8 tissues from non-AS patients. (C and D) H&E staining, TB staining, immunohistochemical staining, and quantitative analysis of Sca1 in spine of PGIS mice. Scale bar, 100 μm. n = 6 per group. (E and F) Immunofluorescence staining and quantitative analysis of Sca1 in spine of PGIS mice. Scale bar, 20 μm. n = 6 per group. (G and H) H&E staining, SOFG staining, immunohistochemical staining, and quantitative analysis of Prx1 in hind paws of male DBA/1 model at the age of 8 and 20 weeks. Scale bar, 200 μm. n = 6 per group. (I and J) Immunofluorescence staining and quantitative analysis of Prx1 in hind paws of male DBA/1 model. Scale bar, 20 μm. n = 6 per group. (K) Schematic diagram of the construction process of GFP-DBA/1 mice parabiosis. (L) H&E staining and immunofluorescence analysis of GFP in the skin tissues of GFP-DBA/1 mice. Scale bars, 500 μm. (M) H&E staining, immunofluorescence analysis of GFP and Sca1 in GFP-DBA/1 mice. Scale bars, 50 μm. n = 6 per group. (N and O) Immunofluorescence staining and quantitative analysis of GFP and CXCL12 in the plantar surface of hind paws of GFP-DBA/1 model at the age of 8 and 20 weeks. n = 6 per group. Scale bar, 100 μm. Data are shown as means ± SEM. Student’s t test with Shapiro-Wilk test was used. DAPI, 4′,6-diamidino-2-phenylindole.

