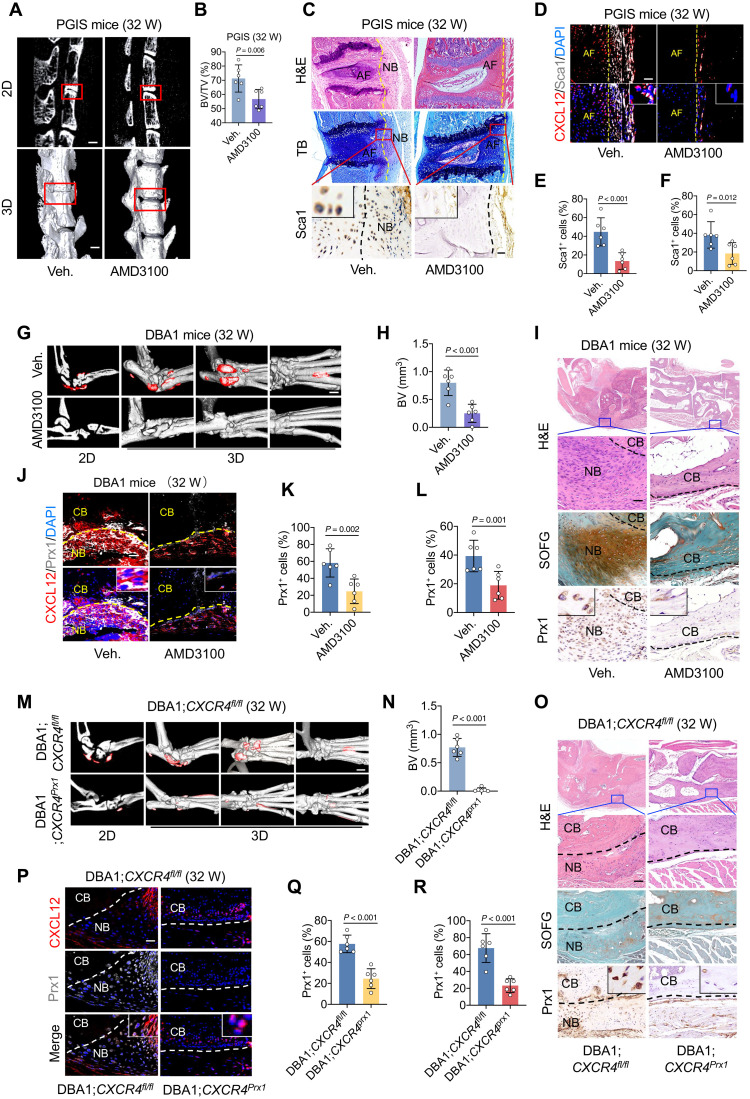
Fig. 3. Inhibition of CXCL12/CXCR4 attenuates OPC migration and pathological new bone formation.
(A and B) μCT images and quantitative analysis of pathological new bone formation in spine of PGIS mice. Scale bars, 500 μm. n = 6 per group. Veh., vehicle. (C) H&E staining, TB staining, immunohistochemical staining of Sca1 in spine of PGIS mice at the age of 32 weeks after AMD3100 administration. Scale bar, 200 μm. n = 6 per group. (D) Immunofluorescence staining of Sca1 and CXCL12 in PGIS mice. Scale bar, 20 μm. n = 6 per group. (E) Quantitative analysis of Sca1 in (C). (F) Quantitative analysis of Sca1 in (D). (G and H) μCT images and quantitative analysis of pathological new bone formation in hind paw of male DBA/1 model at the age of 32 weeks after AMD3100 administration. Scale bar, 500 μm. n = 6 per group. (I) H&E staining, SOFG staining, and immunohistochemical staining of Prx1 in hind paw of male DBA/1 model. Scale bar, 200 μm. n = 6 per group. (J) Immunofluorescence staining of Prx1 and CXCL12 in hind paw of male DBA/1 mice. Scale bar, 20 μm. n = 6 per group. (K) Quantitative analysis of Prx1 in (J). (L) Quantitative analysis of Prx1 in (I). (M and N) μCT images and quantitative analysis of pathological new bone formation in hind paw of DBA/1;CXCR4fl/fl mice and DBA/1;CXCR4prx1 mice. Scale bar, 500 μm. (O) H&E staining, SOFG staining, immunohistochemical staining of Prx1 in DBA/1;CXCR4fl/fl mice and DBA/1;CXCR4prx1 mice. Scale bar, 100 μm. n = 6 per group. (P) Immunofluorescence staining of Prx1 and CXCL12 in hind paw of DBA/1;CXCR4fl/fl mice and DBA/1;CXCR4prx1 mice. Scale bar, 20 μm. n = 6 per group. (Q) Quantitative analysis of Prx1 in (P). (R) Quantitative analysis of Prx1 in. (O) Data are shown as means ± SEM. Student’s t test with Shapiro-Wilk test was used. AMD3100, CXCR4 inhibitor.

