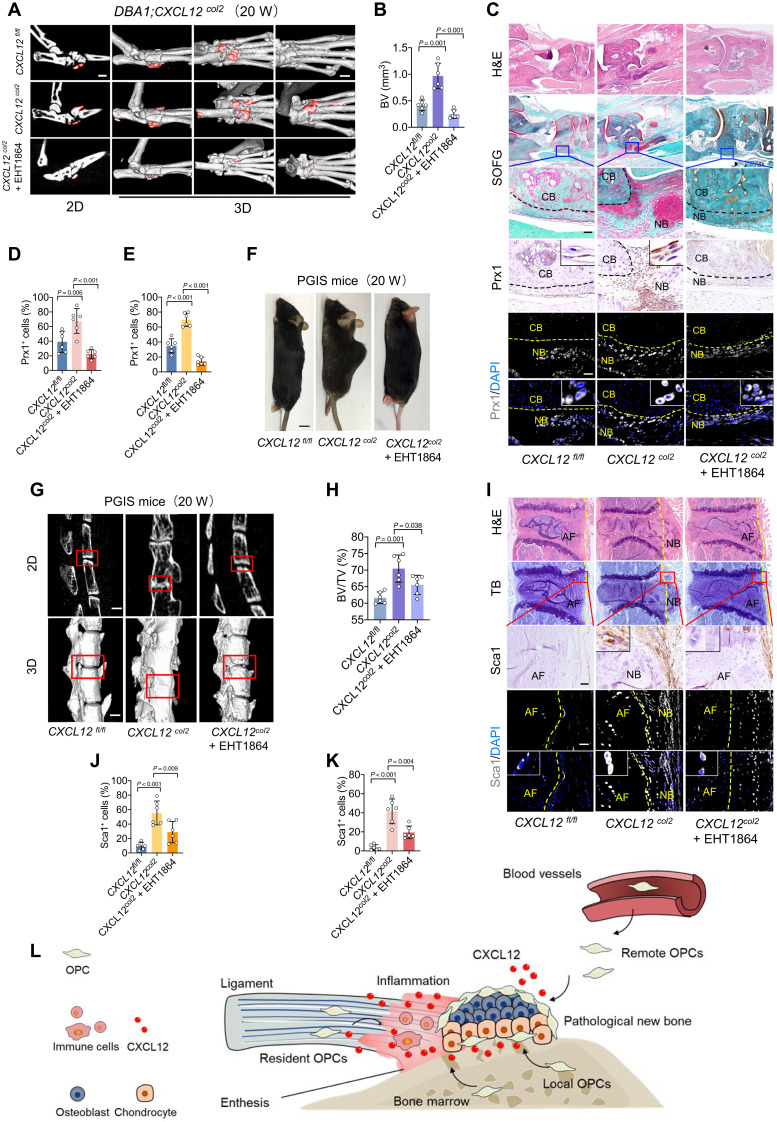
Fig. 6. CXCL12Col2-cre mice develop an ankylosis phenotype.
(A and B) μCT images and quantitative analysis of pathological new bone formation in hind paw of DBA/1;CXCL12Col2 mice at the age of 20 weeks with or without EHT1864 administration. Scale bars, 500 μm. n = 6 per group. ANOVA (F2,15 = 34.40). (C) H&E staining, SOFG staining, immunohistochemical staining, and immunofluorescence staining of Prx1 in plantar surface of hind paw of DBA/1;CXCL12Col2 mice at the age of 20 weeks with or without EHT1864 administration. Scale bars, 200 μm. n = 6 per group. (D and E) Quantitative analysis of Prx1 in (C). ANOVA (F2,15 = 17.62; F2,15 = 71.39). (F) Photo of CXCL12Col2 mice at the age of 20 weeks with or without EHT1864 administration. Scale bar, 5 mm. (G and H) μCT images and quantitative analysis of pathological new bone formation in the spine of CXCL12Col2 PGIS mice at the age of 20 weeks with or without EHT1864 administration. Scale bars, 200 μm. n = 6 per group. ANOVA (F2,15 = 34.74). (I) H&E staining, TB staining, immunohistochemical staining, and immunofluorescence staining of Sca1 in spine of CXCL12Col2 PGIS mice at the age of 20 weeks with or without EHT1864 administration. Scale bars, 200 μm. n = 6 per group. (J and K) Quantitative analysis of Sca1 in (I). ANOVA (F2,15 = 29.55; F2,15 = 18.36). (L) Schematic diagram illustrating CXCL12-induced pathological new bone formation and recruitment of OPCs. Data are shown as means ± SEM. One-way ANOVA with Levene’s test, followed by the Tukey’s post hoc test was used.

