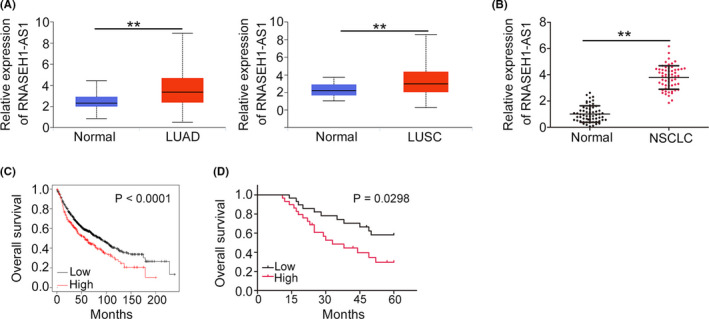
FIGURE 1.

High RNASEH1‐AS1 expression is verified in NSCLC. (A) RNASEH1‐AS1 level in LUAD and LUSC tissues was analyzed utilizing TCGA. (B) qRT‐PCR was used to determine the RNASEH1‐AS1 levels in NSCLC tissues. (C) Kaplan–Meier Plotter was utilized to analyze the relationship between RNASEH1‐AS1 level and overall survival in patients with LUAD and LUSC. (D)The survival of NSCLC patients in our cohort with high‐ or low RNASEH1‐AS1 level. **p<0.01
