
FIGURE 6.
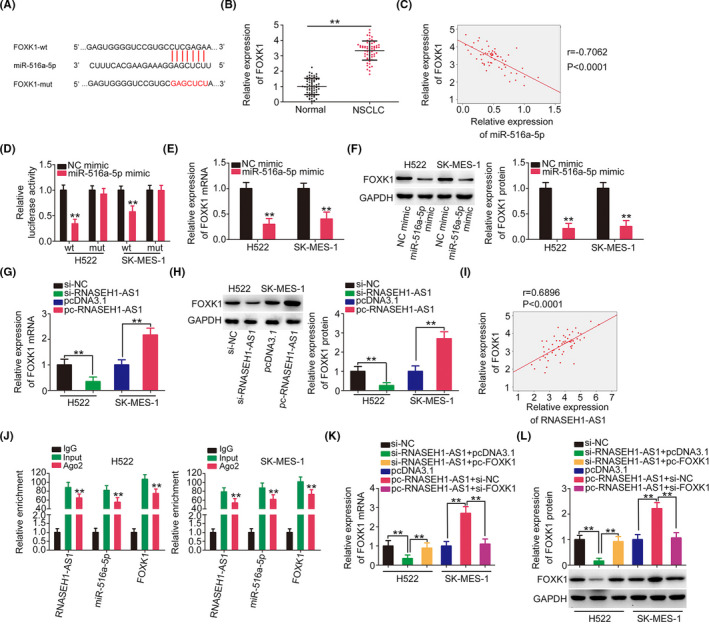
FOXK1 is regulated by the RNASEH1‐AS1/miR‐516a‐5p axis. (A) The wt and mut sequences between miR‐516a‐5p and FOXK1 are shown. (B) FOXK1 level in NSCLC. (C) The expression relationship between miR‐516a‐5p and FOXK1 in NSCLC tissues. (D) The luciferase activity of NSCLC cells after cotransfection with FOXK1‐wt or FOXK1‐mut and the miR‐516a‐5p mimic or NC mimic was detected. (E, F) FOXK1 expression was measured in miR‐516a‐5p‐overexpressing NSCLC cells. (G, H) RNASEH1‐AS1‐knockdown or RNASEH1‐AS1‐overexpressing NSCLC cells were subjected to the assessment of FOXK1 expression. (I) The expression relationship between FOXK1 and RNASEH1‐AS1 in NSCLC tissues. (J) RIP experiment verified the interaction among RNASEH1‐AS1, miR‐516a‐5p, and FOXK1. (K, L) si‐RNASEH1‐AS1‐transfected or pc‐RNASEH1‐AS1‐transfected NSCLC cells were treated with the miR‐516a‐5p inhibitor or the miR‐516a‐5p mimic. Then, FOXK1 expression was examined in the different groups. **p<0.01