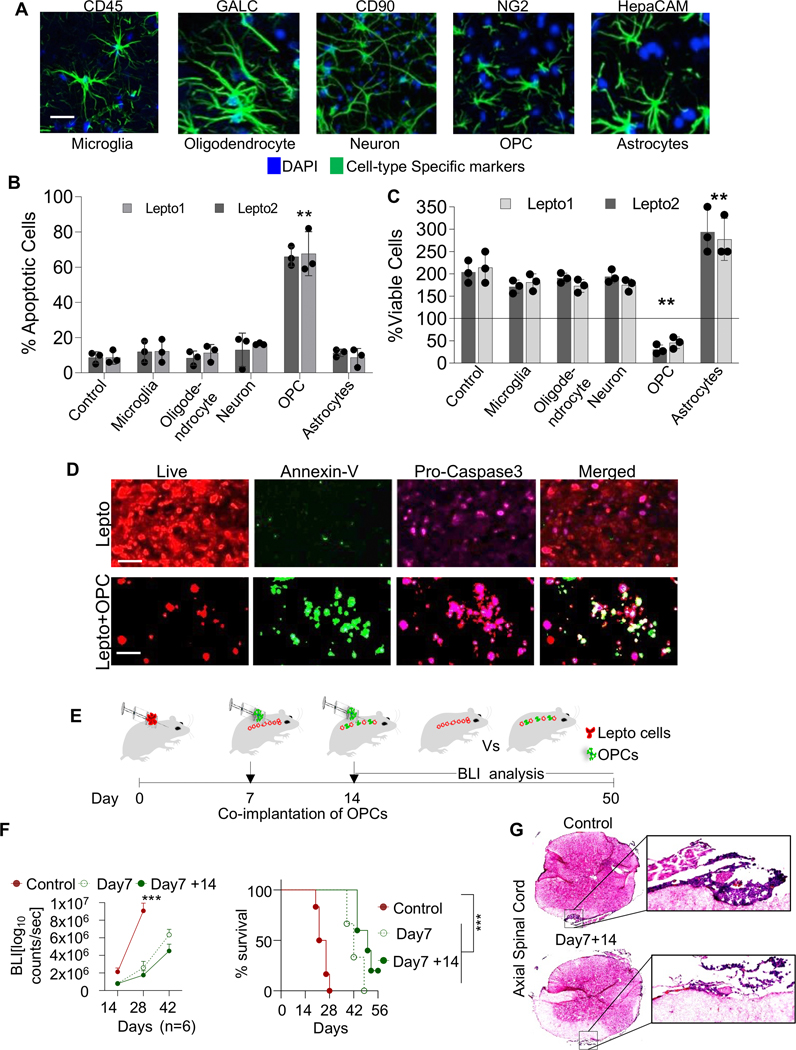
Figure 1. The presence of OPCs reduces HER2+ LC cell viability.
(A.) Immunofluorescence (IF) images of various CNS cell types immuno-panned from human iPSCs and stained with the indicated antibodies. Nuclei were counterstained with DAPI (blue). Scale bar=100 μm.
(B.) Annexin-V FACS-based analysis of Lepto1 and Lepto2 cells (seeded at 0.5×10⁵ density/well of a 24 well plate, in the bottom chamber) co-cultured with the indicated human CNS cell populations (seeded at 0.5×10⁵ density/well of 24 well plate, in the top inserts). Co-culture with OPCs increased the proportion of apoptotic Lepto cells (n=3). **p<0.001 relative to control Lepto cells exposed to no CNS cell types.
(C.) Viability of Lepto1 and Lepto2 (seeded at 0.1×10⁵ density/well of a 96 well plate, in the bottom chamber) lines co-cultured with various CNS cell types (derived in Fig. 2A) (all seeded at 0.1×10⁵ density/well of a 96 well plate, in the top inserts) for 48 h, measured using CellTiter-Glo assays (n=3). **p<0.001 relative to control Lepto cells exposed to no CNS cell types.
(D.) IF images of mCherry: LUC-labeled (red) Lepto cells stained with Annexin-V (green) and Pro-Caspase 3 (magenta) after 48 h of treatment with or without OPC-conditioned medium. Scale bar=50 μm.
(E.) Schematic showing the protocol used for the in vivo characterization of the effects of OPCs on Lepto cell growth. mCherry: LUC-labeled Lepto cells (100K, red) were injected into the cisternae magna of adult NOD/SCID mice on day 0, and OPCs (100K, green) were injected on days 7 and/or 14. Tumor growth was monitored by BLI from days 14 to 50, with representative images acquired starting on day 28.
(F.) (Left panel) Quantitative analyses showing that the mice that received OPCs exhibited reduced tumor growth (n=6). ***p<0.001 relative to mice with OPCs implanted on days 7 and 14. (Right panel) Kaplan–Meier curves showing the overall survival of mice implanted with Lepto cells on day 0 only (solid red line) or co-implanted with OPCs on day 7 (dashed green line) or on days 7 and 14 (solid green line). ***p<0.001.
(G.) Histopathologic analyses of the H&E stained axial spinal cord sections from control Lepto infused and Lepto+ OPC (OPC infusion on D7 and D14) co-infused mice on the Left and 20x magnified regions showing Lepto deposition

