Figure 1.

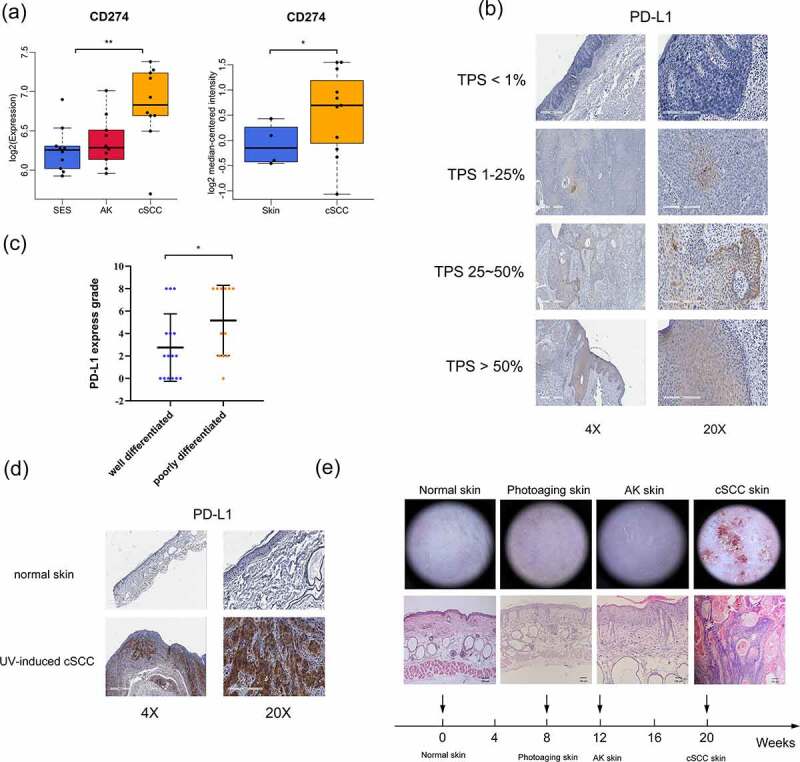
PD-L1 expression is correlated with the progression of cSCC. (a) PD-L1 expression as indicated in the GEO and Oncomine databases. (b) PD-L1 expression in cSCC patient tumor tissues, determined by IHC. The tumor proportion score (TPS) represents the proportion of PD-L1-positive expression. (c) PD-L1 expression grade of different differentiated cSCC tissues (n = 28). (d) PD-L1 expression in UV-induced cSCC mouse tissues as determined by IHC. (e) Histological and dermoscopic images of normal skin and cSCC skin during UV-induced cSCC mouse model construction. *p < 0.05, **p < 0.01; the scale bar is 600 μm for the 4X images, 200 μm for the 20X images and 100 μm for HE staining.
