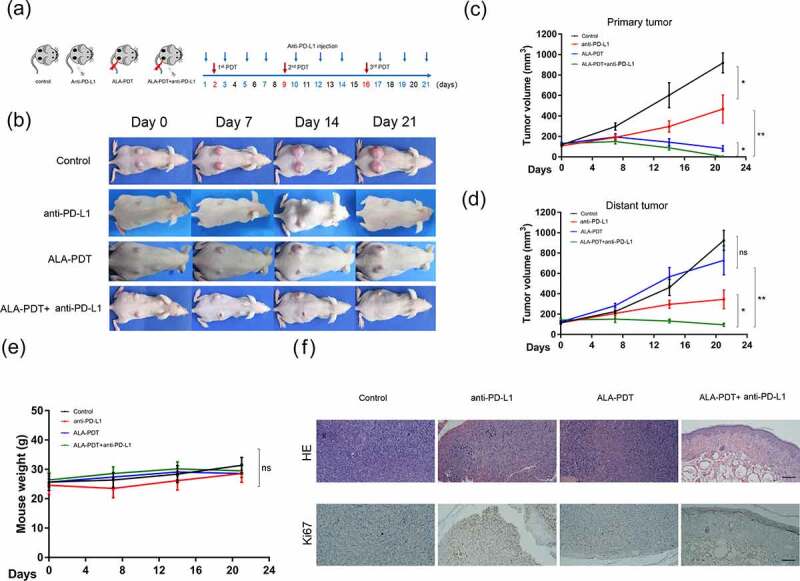
Figure 2.

Synergistic antitumor effects of an anti-PD-L1 mAb and ALA-PDT in an implanted cSCC mouse model. (a) Diagram of the experimental design of ALA-PDT and an anti-PD-L1 mAb applied to the cSCC mouse model. (b) Representative tumor growth in each group. (c) Primary tumor growth curve of each group (n = 5 for each group); (d) distant tumor growth curve of each group (n = 5 for each group). (e) Mouse weight curve of each group. (f) Representative HE and Ki67 staining of distant tumors in each group. *p < 0.05, **p < 0.01; the scale bar is 200 μm.
