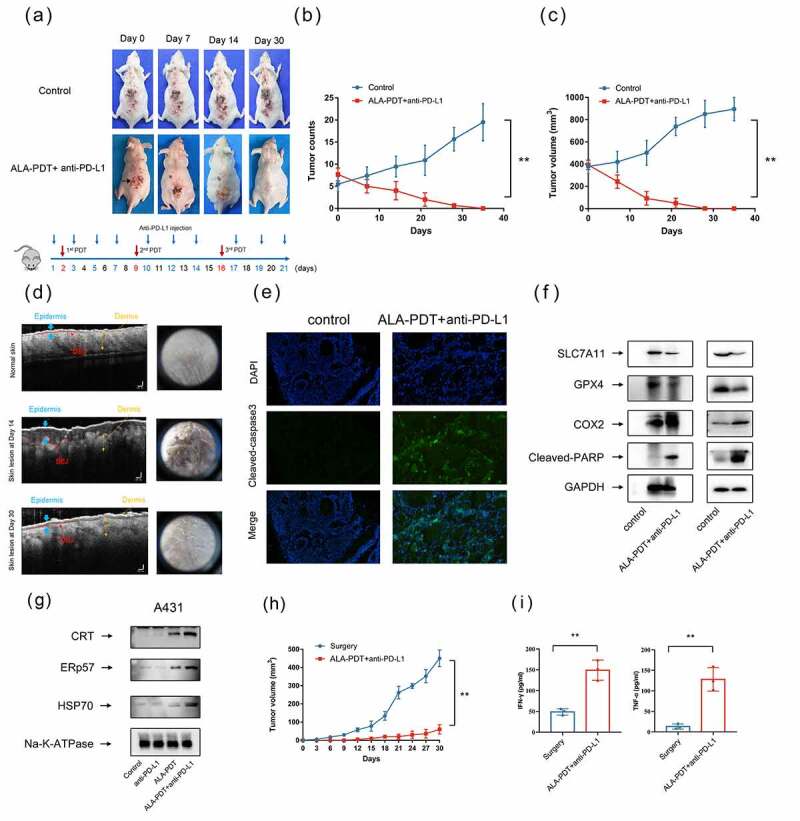
Figure 4.

Synergistic antitumor effects of an anti-PD-L1 mAb and ALA-PDT in a UV-induced cSCC mouse model. (a) Representative tumor growth of the UV-induced cSCC mouse model. ALA-PDT was applied to tumors in the red circle, and anti-PD-L1 mAb was intraperitoneally injected. (b) Tumor count curve of the UV-induced cSCC mouse model (n = 3 for each group). (c) Largest tumor growth curve of the UV-induced cSCC mouse model (n = 3 for each group). (d) OCT analyses of mouse skin structure, left panel. Dermoscopic images of mouse skin, right panel. (e) After 24 h of treatment, immunofluorescence of tumor tissue in the UV-induced cSCC mouse model was detected. (f) After 24 h of treatment, tumor tissue lysates of the UV-induced cSCC mouse model (left panel) and implanted cSCC mouse model (right panel) were subjected to Western blotting with the indicated antibodies. The blots were probed with GAPDH as the loading control. (g) After 6 h of treatment, A431 cell membrane lysates were subjected to Western blotting using the indicated antibodies. The blots were probed with Na-K-ATPase as the loading control. (h) Tumor growth curves of rechallenged tumors inoculated 30 days post-elimination of their first tumors by either surgery or combined treatment with anti-PD-L1 mAb and ALA-PDT (n = 3 for each group). (i) Cytokine levels of IFN-γ and TNF-α in sera from mice isolated 7 days after mice were rechallenged with secondary tumors. *p < 0.05, **p < 0.01.
