
Figure 2.
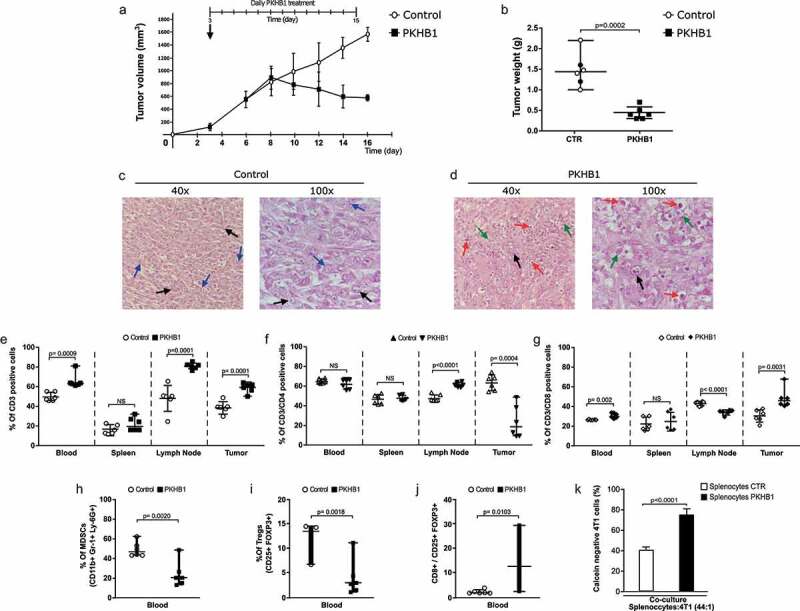
PKHB1 treatment induces tumor reduction and T cells distribution. Mice were inoculated s.c. with 5 × 10⁵ 4T1 viable cells and when tumor reached 70–120mm3 were treated with sterile water (Control, n = 6) or PKHB1 (400 μg of PKHB1 daily, n = 6), tumor volume was measured three times per week. (A) Graphs indicate the mean of the tumor volume in PBS-treated group (Control, n = 6) or PKHB1-treated group (PKHB1, n = 6). (B) Graphs indicate the tumor weight of control and treated mice at day 16. (C,D) Histology from tumors of control or PKHB1-treated mice stained with H&E. Tumor cells (black arrows), mitotic cells (blue arrows), cellular debris (green arrows) and immune system cells infiltration (red arrows). (E, F, and G) Graphs show the percent of CD3+, CD4+, and CD8+ cells in blood, spleen, lymph node, and tumor of control or PKHB1-treated mice at day 16. (H-I) Graphs show the percent of MDSCs and Tregs in blood of control or PKHB1-treated mice at day 16. (J) Graph show the ratio of CD8/Tregs cells of control or PKHB1-treated mice at day 16. (K) Graphs show the percent of calcein negative 4T1 cells after the co-culture with splenocytes of control (n = 4), or PKHB1-treated mice (n = 4). NS = Not significant.