
Figure 4.
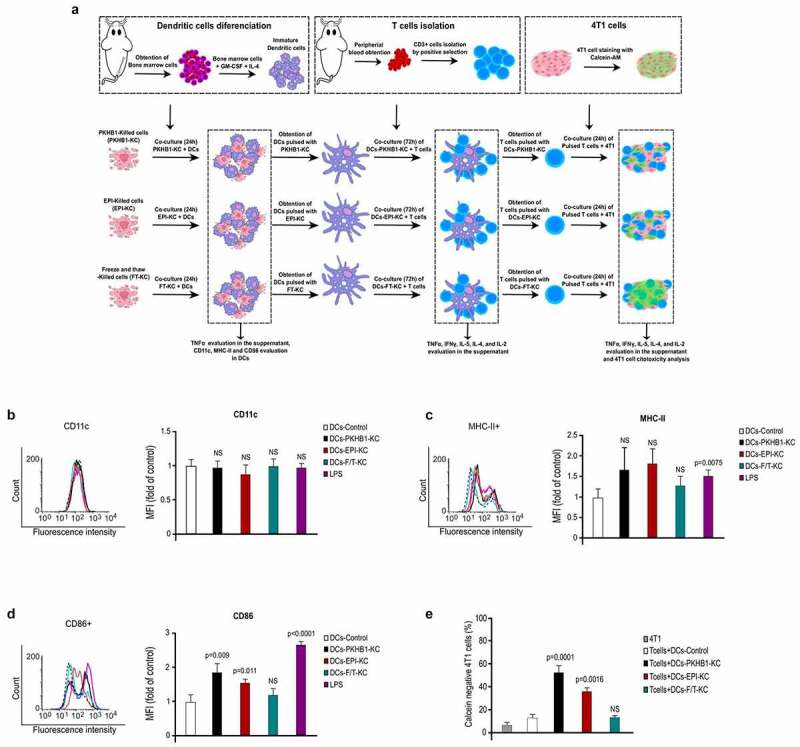
PKHB1-Killed cells induce antitumor immune responses ex vivo. (A) Schema of the ex vivo experiments. (B) Representative histograms from flow cytometry analyses of CD11c expression on DCs left with medium (CTR) or pulsed 24 h with a PKHB1-KC, EPI-KC, FT-KC, or LPS, graphs of the means obtained by FACS (right side). (C) Representative histograms from flow cytometry analyses of MHC-II expression on DCs treated as in A, graphs of the means obtained by FACS (right side). (D) Representative histograms from flow cytometry analyses of CD86 expression on DCs treated as in A, graphs of the means obtained by FACS (right side). (E) Graphs shown are means (± SD) of triplicates of three independent experiments from flow cytometry analyses of 4T1 cells stained with calcein-AM and co-cultured with T lymphocytes (unprimed or primed). NS = Not significant.