
Figure 6.
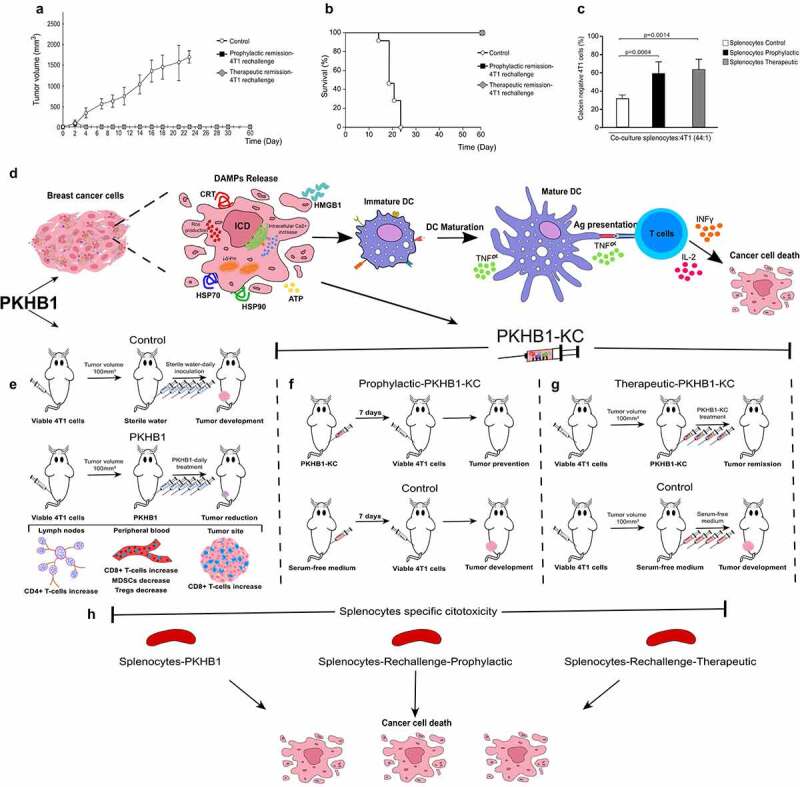
PKHB1-KC prophylactic and therapeutic application induces long-term antitumor effect, schematic representation of the PKHB1-effect. Mice in remission (30 days) after PKHB1 prophylactic or therapeutic PKHB1-KC application were re-challenged with 5 × 10⁵ 4T1 viable cells. (A) Graph indicates the mean of the tumor growth in PBS-treated group (Control; n = 9), prophylactic re-challenged group (Prophylactic remission-4T1 re-challenge, n = 9) or therapeutic re-challenged group (Therapeutic remission-4T1 re-challenge, n = 9). (B) Kaplan–Meier survival graph of mice treated as in A over time. (C) Graphs show the percent of calcein negative 4T1 cells after co-culture with splenocytes control (n = 4), prophylactic (n = 4) or therapeutic (n = 4) re-challenged mice. (D) PKHB1 induces ROS production, intracellular Ca2+ accumulation, loss of mitochondrial membrane potential (ΔΨm), leading to DAMPs exposure and release in breast cancer cells. Neoantigens and DAMPs exposure/release induced by PKHB1 promotes DCs maturation, which triggers T cell activation to induce cancer cytotoxicity. (E) However, PKHB1-treatment in vivo induces T cell redistribution in lymph nodes, peripheral blood and intratumorally, leading to tumor reduction. (F) PKHB1-KC prophylactic vaccination prevented tumor establishment. (G) PKHB1-KC therapeutic application induced tumor remission. (H) PKHB1-treatment, PKHB1-KC prophylactic or therapeutic application induced tumor-specific splenocytes’ cytotoxicity.