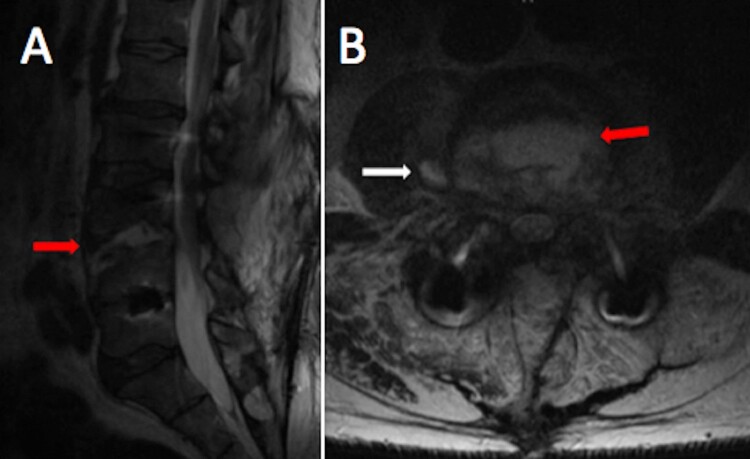
Figure 4.
(A) Sagittal T2 weighted magnetic resonance imaging (MRI) cut of the lumbar spine demonstrating fluid in the L3–4 disc space (arrow) and surrounding bone marrow edema. (B) Axial T2 weighted MRI cut at the level of the L4 superior endplate demonstrating bone marrow edema (thick arrow) and right psoas abscess (thin arrow).

