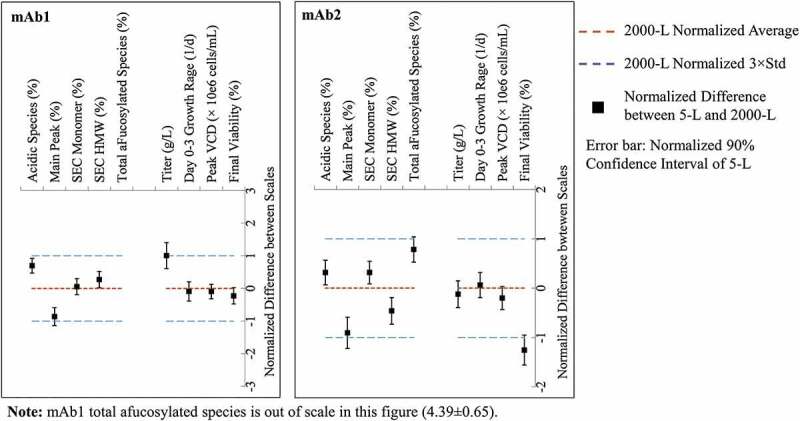
Figure 4.
TOST analysis for key quality and performance attributes of mAb1 and mAb2 between 5-L SDM and 2000-L manufacturing.Maximum allowable difference (MAD) was set to ±3 standard deviations of the manufacturing scale data (blue dash line). The difference between 5-L and 2000-L (■) was normalized by setting 2000-L average as zero (red dash line). Titer and main peak of mAb1, and main peak and afucosylation of mAb2 were equivalent in mean only because one side of the error bas was out of MAD interval. Afucosylation of mAb1 was inequivalent. Final cell viability of mAb2 failed to be equivalent. As these attributes did not pass TOST analysis, a practical equivalence was evaluated based on secondary criteria in Supplemental Table 3.
Alt Text: Five key quality attributes and four key performance attributes at the production bioreactor step are compared between 5-L SDM and 2000-L manufacturing for mAb1 and mAb2 via this TOST analysis graph. A conclusion of equivalence is achieved for most of the attributes as the 90% confident interval of 5-L are contained in the MAD.