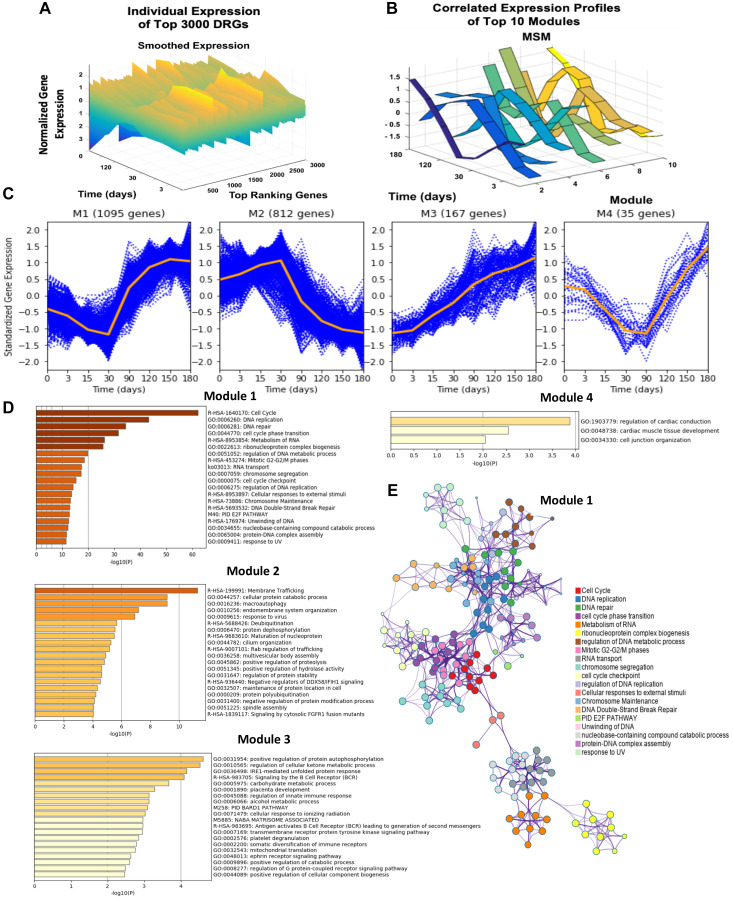
Figure 2. Dynamic gene expression analysis results, gene expression trends of top four modules, and network analysis of the top four modules DRGs using Metascape.
(A) Presents the individual time-resolved expression trends for the top 3 000 dynamic response gene probes. These 3 000 probes are comprised of 2 305 identifiable unique genes. Y-axis represents the normalized expression of genes as described in the methods section. (B) Illustrates the multiple-sampling method (MSM) results of mean expression trends for the 10 largest modules. (C) The time-resolved expression trends for the top four largest modules are shown. Each blue dotted curve represents one gene, and the middle orange line illustrates the mean expression at each time point. (D) Presents the significantly enriched terms in modules 1–4 based on the corresponding Fisher’s Exact Test p-values. (E) Presents the statistically enriched terms in module 1 hierarchically clustered into a tree based on Kappa-statistical similarities among gene memberships.

