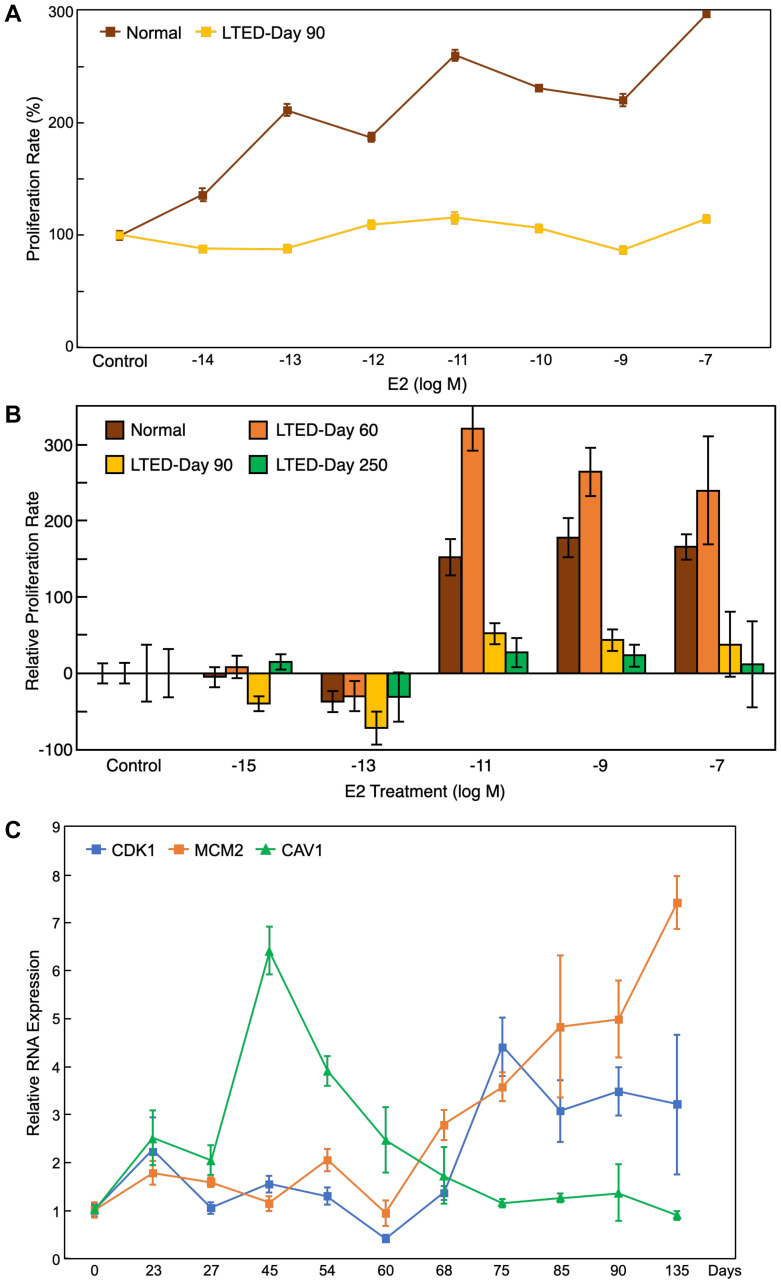
Figure 5. Proliferation assay and qRT-PCR results support bioinformatic findings.
(A) Proliferation assay of the LTED cells at day 90 and normal MCF7 cells under different treatment doses of E2 (from 10–14 to 10–7 M) showed that LTED cells were not responsive to estrogen treatment. (B) Proliferation assay of the LTED cells at different days under several doses of E2 (from 10–15 to 10–7 M) show no responsiveness to E2 treatment by day 250. (C) qRT-PCR results for MCM2, CDK1, and CAV1 confirmed that the gene expression patterns in vitro match their expected gene expression patterns from microarray bioinformatics analysis. All values represent mean ± SEM (n = 3–6).

