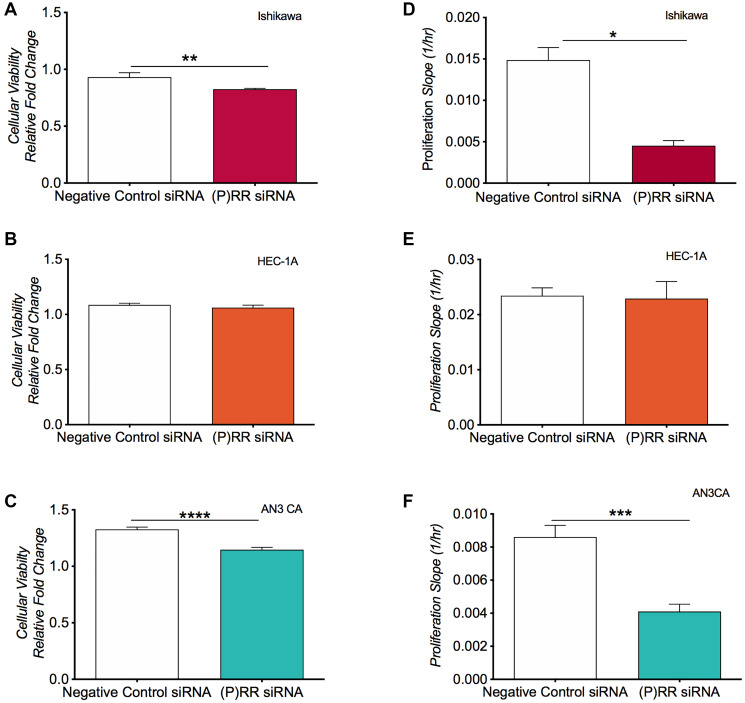
Figure 3. Analysis of cellular viability and cellular proliferation following siRNA knockdown of ATP6AP2 in the endometrial epithelial cancer cell lines.
Cell viability was assessed using the fluorometric resazurin assay for the Ishikawa (A), HEC-1-A (B) and AN3CA (C) cell lines. Cell viability was determined as the mean ± SEM fluorescence intensity value measured as a relative conversion fold change of non-fluorescent blue to fluorescent pink dye (with excitation emission wavelengths of 530 nm and 590 nm). (D–F) Proliferative capacity was assessed using xCelligence technology whereby electrical impedance acted as a surrogate measure of a cell’s proliferative rate in the three cell lines. Mean ± SEM values are plotted in histograms. * P < 0.05, ** P < 0.01, *** P < 0.001 and **** P < 0.0001.

