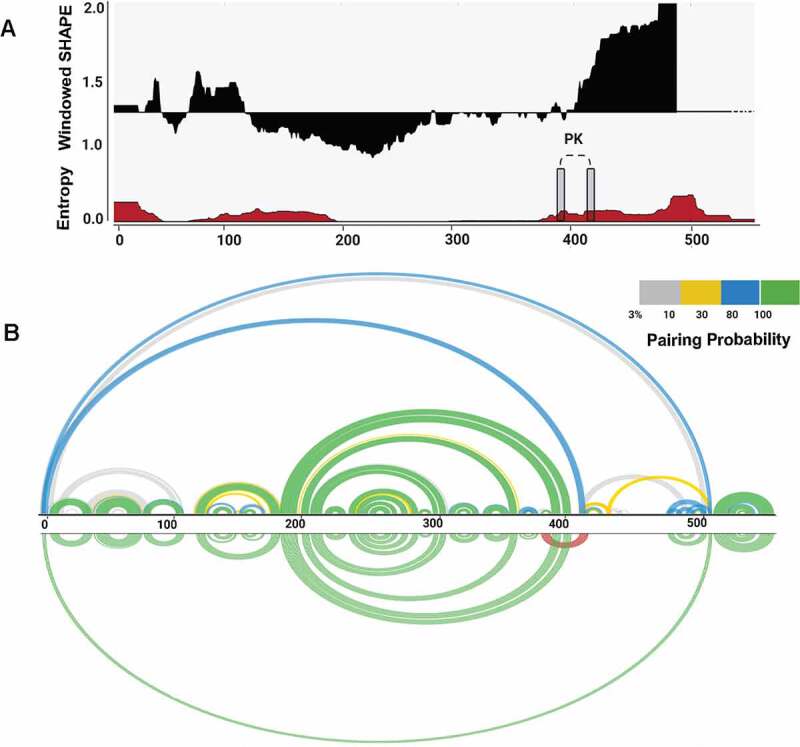
Figure 2.

Structural features of BVDV IRES RNA. (A) Windowed SHAPE reactivities (black) and Shannon entropies (brown) are indicated. The X-axis represents the nucleotide position, and Y-axis corresponds to windowed SHAPE reactivities (top) and entropy values (bottom). Single-stranded regions involved in pseudoknot formation are indicated with grey rectangles. (B) Arc plots represent the base-pairing probabilities for BVDV IRES RNA. The top arc plot is colour-coded according to the pairing probability scale. The bottom arc plot includes the predicted H-type pseudoknot (red).
