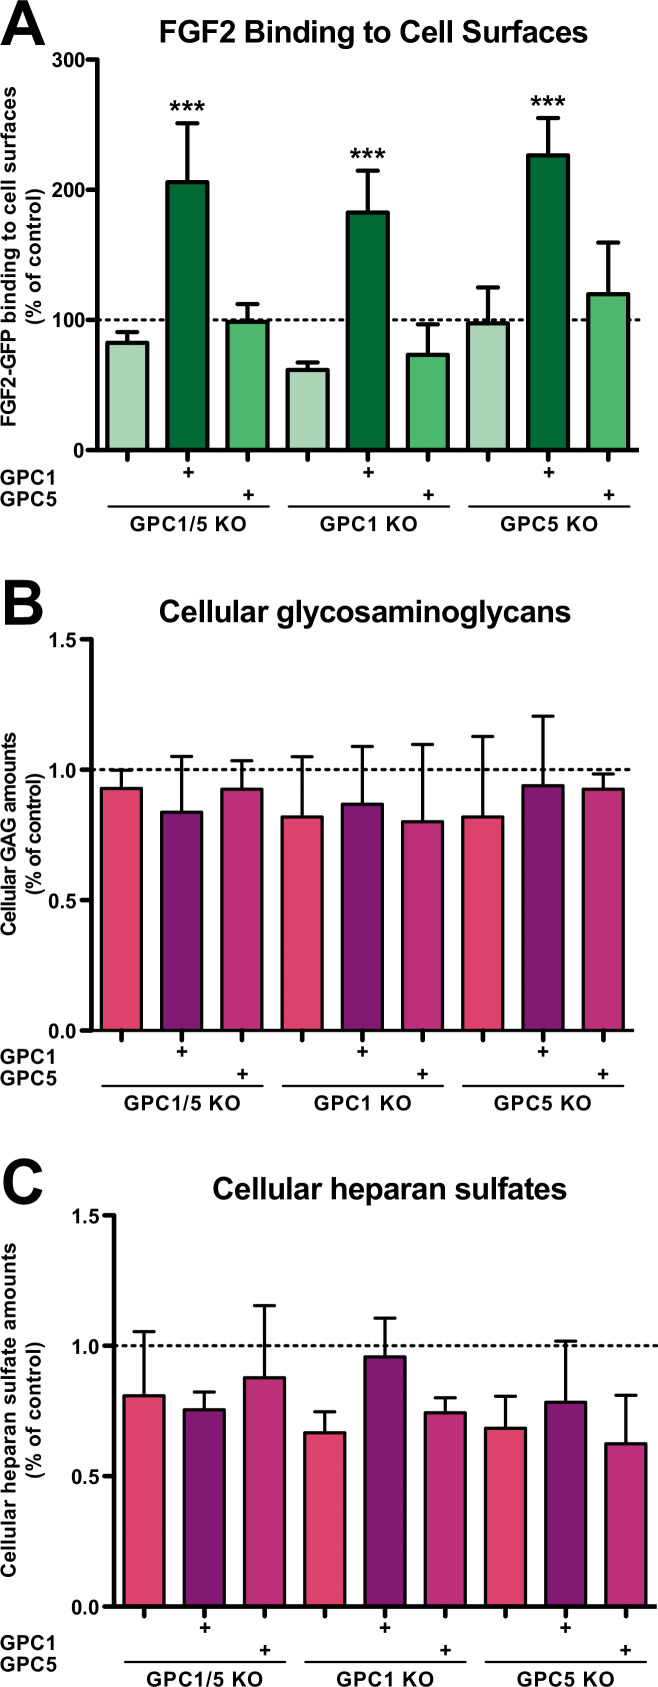
Figure 3. Fibroblast growth factor 2 (FGF2)-GFP binding to cell surfaces is increased in Glypican-1 (GPC1)-overexpressing cells.
(A) Quantitative analysis of the FGF2-GFP binding capacity of cell surfaces under the experimental conditions indicated using flow cytometry. Standard deviations are shown (n = 5). Statistical significance was analyzed using a one-way ANOVA test combined with Tukey’s post hoc test (*, p ≤ 0.05; **, p ≤ 0.01, and ***, p ≤ 0.001). (B) Quantification of the total amounts of GAG chains under the experimental conditions indicated. Standard deviations are shown (n = 4). Statistical significance was analyzed using a one-way ANOVA test combined with Tukey’s post hoc test (*, p ≤ 0.05; **, p ≤ 0.01, and ***, p ≤ 0.001). (C) Quantification of the total amounts of heparan sulfate chains under the experimental conditions indicated. Standard deviations are shown (n = 3). Statistical significance was analyzed using a one-way ANOVA test combined with Tukey’s post hoc test (*, p ≤ 0.05; **, p ≤ 0.01, and ***, p ≤ 0.001). For details, see Materials and methods.

