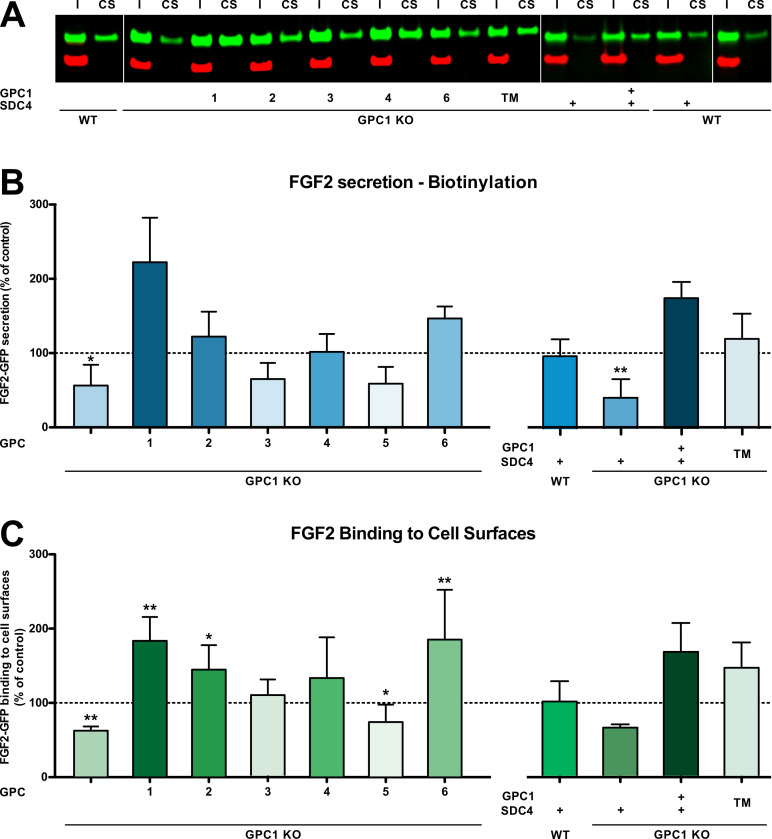
Figure 4. Glypican-1 (GPC1) is the principal heparan sulfate proteoglycan involved in unconventional secretion of fibroblast growth factor 2 (FGF2).
(A) Representative example for the raw data of cell surface biotinylation experiments used to quantify and to statistically evaluate unconventional secretion of FGF2 under the conditions indicated (I = input; CS = cell surface). Standard deviations are shown (n = 5). (B) Quantitative comparison of all six GPC family members, GPC1 with a transmembrane anchor (‘TM’) and SDC4 (syndecan 4) with regard to their potential to drive FGF2 secretion upon overexpression in a GPC1 knockout background based on cell surface biotinylation experiments. Standard deviations are shown (n = 5). (C) Quantitative comparison of all six GPC family members, GPC1 with a transmembrane anchor (‘TM’) and SDC4 (syndecan 4) with regard to their potential to affect the cell surface binding capacities for FGF2-GFP. FGF2-GFP binding to cell surfaces was analyzed by flow cytometry. Standard deviations are shown (n = 4). Statistical analyses were based on a two-tailed t-test (*, p ≤ 0.05; **, p ≤ 0.01, and ***, p ≤ 0.001). For details, see Materials and methods.

