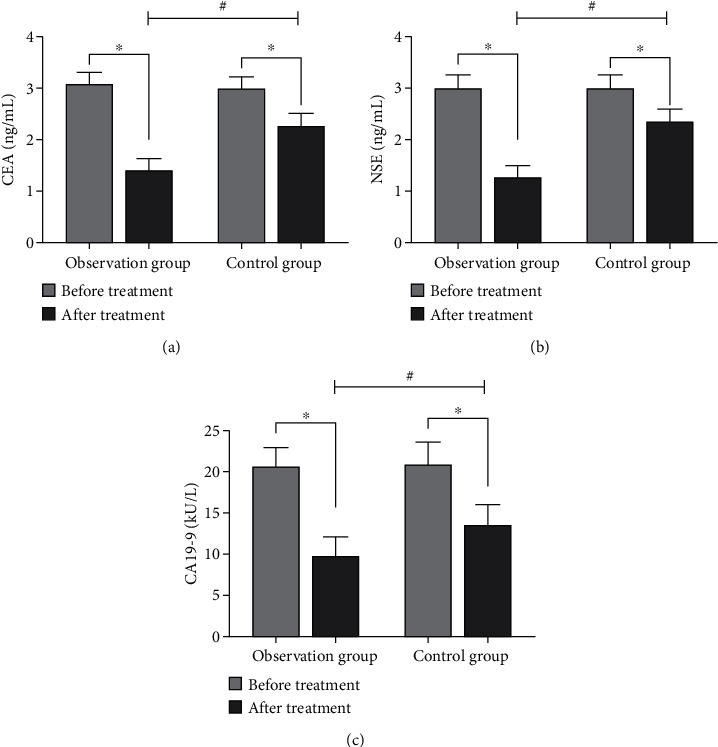
Figure 2.

Comparison of tumor marker levels between the two groups before and after nursing (∗compared with before nursing, P < 0.05; #compared with the control group, P < 0.05). (a) The comparison of CEA levels between the two groups before and after nursing. (b) The comparison of NSE levels between the two groups before and after nursing. (c) The comparison of CA19-9 levels between the two groups before and after nursing.
