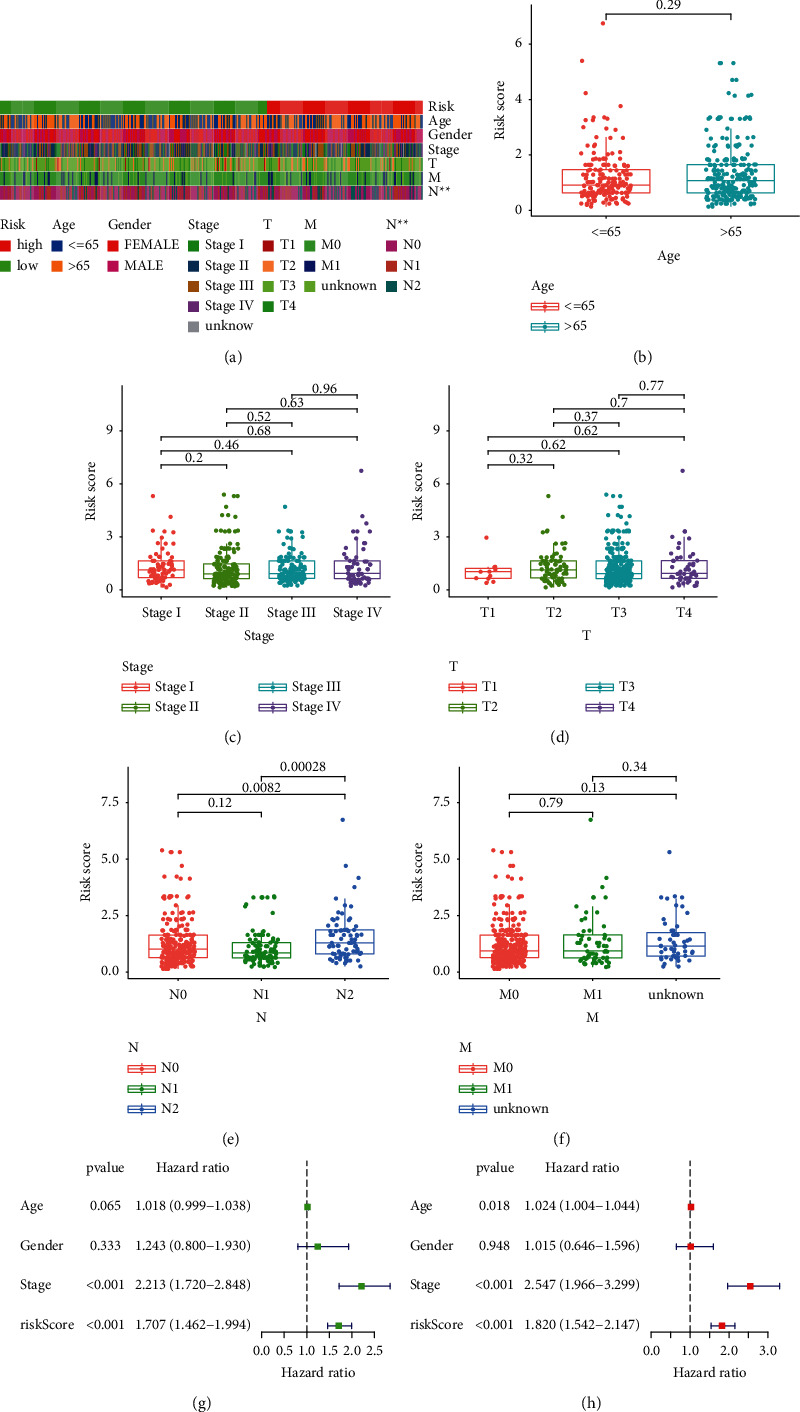
Figure 6.

Whether the signature is an independent prognostic factor and relationship between risk score and clinical characteristics is evaluated. (a) Strip chart of clinical characteristics. (b) Age and risk scores; (c) stage and risk scores; (d) T-stage and risk scores; (e) N-stage and risk scores; (f) M-stage and risk scores; (g) univariate and (h) multivariate Cox regression analysis of risk score and clinical characteristics. ∗represented P < 0.05, ∗∗represented P < 0.01, and ∗∗∗represented P < 0.001.
