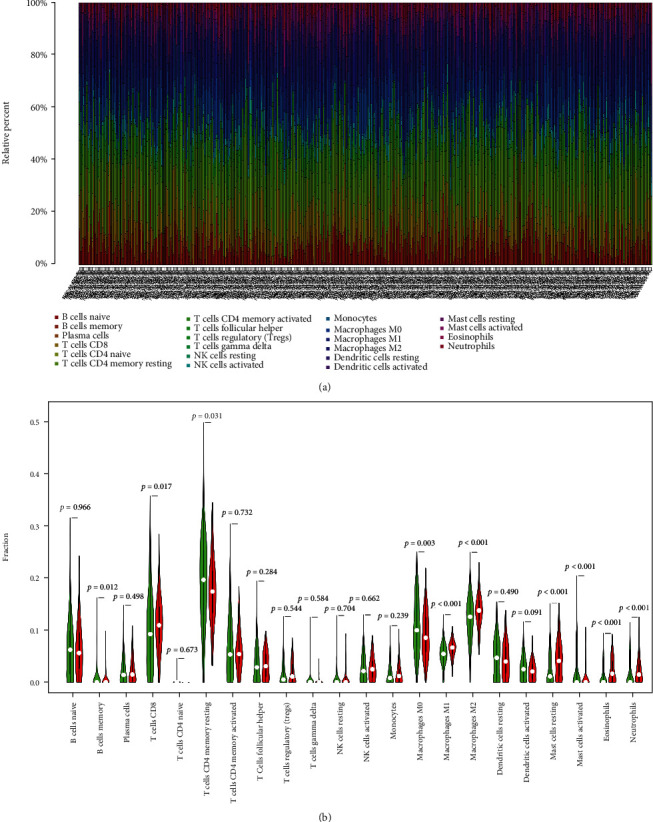
Figure 7.

The relationship between CYSLTR2 and immune cells. (a) Differences in the content of immune cells in different tumor samples. (b) Immune cell infiltration difference between the CYSLTR2 high-expression group and the low-expression group. Red indicates the CYSLTR2 high-expression group, and green indicates the CYSLTR2 low-expression group.
