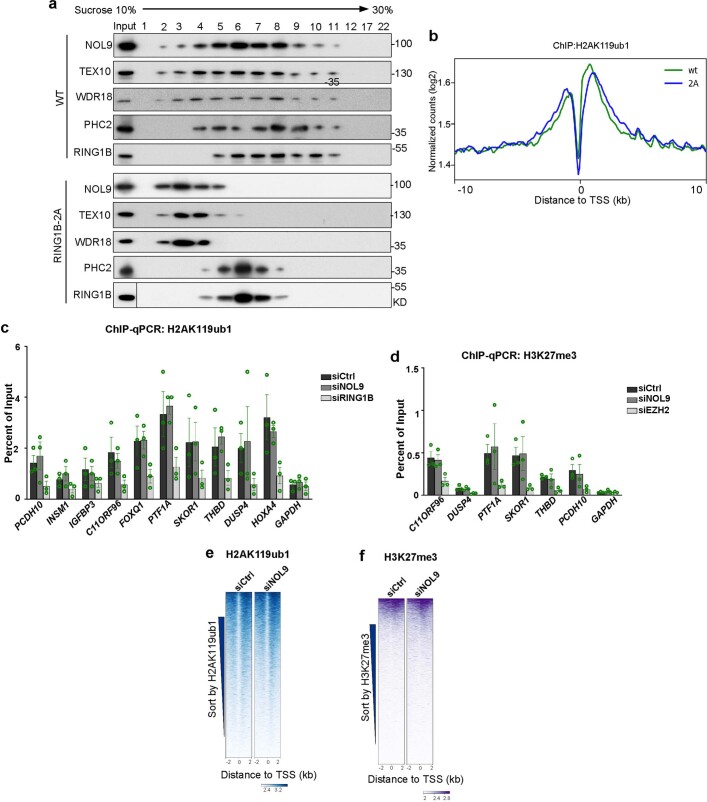
Extended Data Fig. 5. Rixosome effects on H3K27me3 and H2AK119ub1, and rixosome-Polycomb association.
a, Co-fractionation of rixosome and PRC1 subunits. Flag-NOL9-associated and PHC2–Flag-associated proteins purified from cells with wild-type or RING1B-2A and were subjected to 10–30% sucrose gradient sedimentation. Fractions were collected and adsorbed to Strataclean beads and analyzed by immunoblotting with the indicated antibodies. b, Average distribution of H2AK119ub1 ChIP-seq reads (log2) for all annotated genes in wild type (WT) and RING1B-2A (2A) mutant HEK293FT cells. Enrichment levels were normalized with Reads Per Genome Coverage. Read counts per gene were summed in 50-nt bins. c, ChIP-qPCR experiments showing enrichment of H2AK119ub1 at the indicated target genes in siCtrl, siNOL9, and siRING1B treated HEK293FT cells. Error bars represent standard deviations for three biological replicates. Data are presented as mean values +/− SEM. d, ChIP-qPCR showing enrichment of H3K27me3 at the indicated target genes in siCtrl, siNOL9, and siEZH2 treated HEK293FT cells. Error bars represent standard deviations for three biological replicates. Data are presented as mean values +/− SEM. e, Heatmap representations of H2AK119ub1 ChIP-seq from control cells compared to cells depleted of NOL9 at TSS flanking regions. Rank order is by H2AK119ub1 signal from siCtrl cells. Enrichment levels (log2) were normalized with Reads Per Genome Coverage. Color bar at bottom indicates range of read counts per 50-nt bin. f, Heatmap representations of H3K27me3 ChIP-seq from control cells compared to cells depleted of NOL9 at TSS flanking regions. Rank order is by H3K27me3 signal from siCtrl cells. Enrichment levels (log2) were normalized with Reads Per Genome Coverage. Color bar at bottom indicates range of read counts per 50-nt bin.

