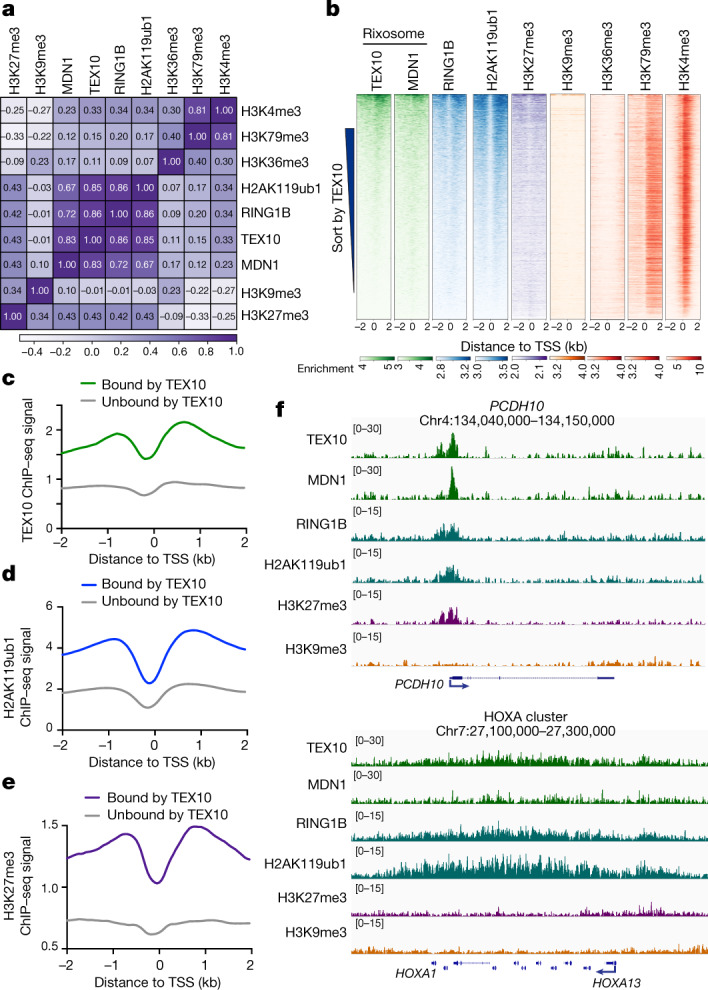
Fig. 2. The rixosome localizes to transcription start sites with high PRC1 and PRC2 occupancy.

a, Matrix depicting Spearman correlation coefficients between ChIP–seq datasets in HEK 293FT cells, calculated using summed read counts ±2 kb from all annotated gene TSSs (hg19). b, Heatmap representations of ChIP–seq of TEX10, MDN1, RING1B and histone modifications (H2AK119ub1, H3K4me3, H3K27me3, H3K9me3, H3K36me3, H3K79me3 and H3K4me3). Rank order is from highest to lowest TEX10 signal. log2 enrichment was normalized to reads per genome coverage. Read counts per gene were averaged in 50-nucleotide (nt) bins. c–e, Average distribution of TEX10 (c), H2AK119ub1 (d) and H3K27me3 (e) ChIP–seq reads at TEX10-bound genes (n = 7,827) versus TEX10-unbound genes (n = 13,177). Read counts per gene were summed in 50-nt bins. All three factors are significantly enriched at TEX10-bound genes, P < 2.2 × 10⁻¹⁶ for TEX10 (c), P < 2.2 × 10⁻¹⁶ for H2AK119ub1 (d), P < 2.2 × 10⁻¹⁶ for H3K27me3 (e); two-tailed Mann–Whitney test, using summed reads in the window ±2 kb from TSS. See Extended Data Fig. 2c, d for other modifications. f, Genomic snapshots of ChIP–seq reads for the indicated experiments at the Polycomb target PCDH10 gene and HOXA cluster. log2 enrichment levels were normalized to reads per genome coverage.
