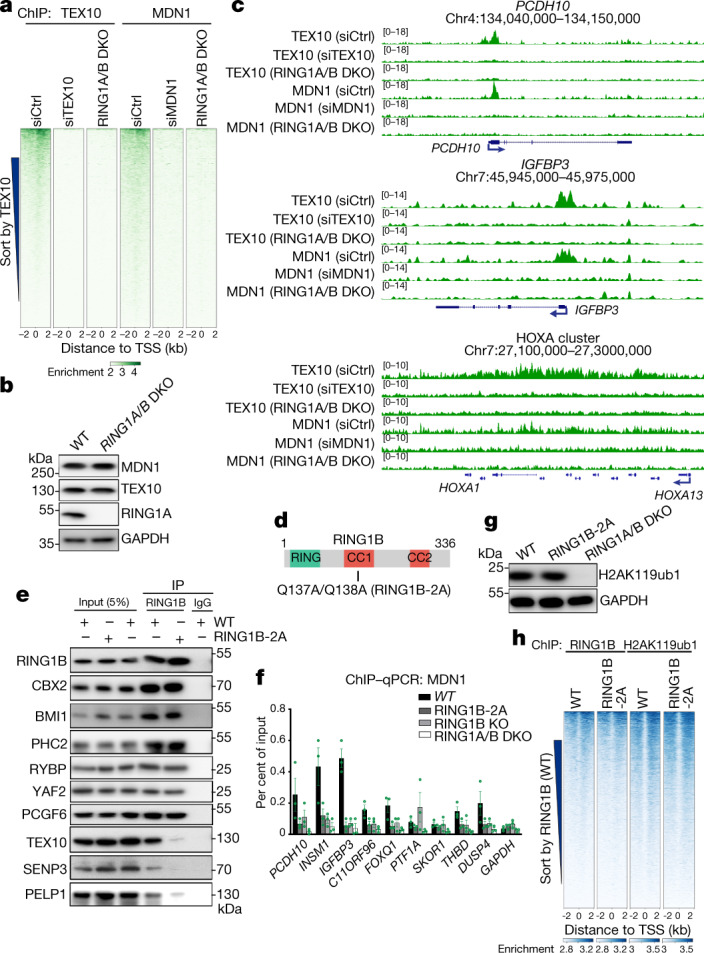
Fig. 3. PRC1 is required for rixosome chromatin targeting.

a, Heatmap representations of ChIP–seq of TEX10 and MDN1 in HEK 293FT cells with the indicated treatments. Rank order is from highest to lowest TEX10 signal in control siRNA (siCtrl)-treated cells. RING1A/B-DKO cells were treated with control siRNA. log2 enrichment levels were normalized to reads per genome coverage. Read counts per gene were summed in 50-nt bins. b, Immunoblots showing indicated protein levels in wild-type (WT) and RING1A/B-DKO cells. c, Genomic snapshots of ChIP–seq reads at Polycomb target genes PCDH10, IGFBP3 and HOXA cluster for the indicated cells. log2 enrichment levels were normalized to reads per genome coverage. d, Schematic of RING1B protein and its domains. CC, coiled-coil domain. The location of RING1B-2A substitutions is indicated. e, Immunoprecipitations showing the effect of RING1B-2A substitutions on the interaction of RING1B with PRC1 subunits CBX2, PHC2, BMI1 (PCGF4), RYBP, YAF2 and PCGF6, and rixosome subunits PELP1, TEX10 and SENP3 in HEK 293FT cells. f, ChIP–qPCR experiments showing the localization of MDN1 at the indicated genes in wild type, RING1B-2A, RING1B-KO and RING1A/B-DKO cell lines. Primers used for quantitative PCR targeted the first exon of each gene. GAPDH served as a control. Data are presented as mean ± s.e.m. for three biological replicates. g, Immunoblots showing total H2AK119ub1 levels in wild-type, RING1B-2A and RING1A/B-DKO HEK 293FT cells. h, Heatmap representations of ChIP–seq of RING1B and H2AK119ub1 in wild-type, RING1B-2A HEK 293FT cells. Rank order is from highest to lowest RING1B signal in wild-type cells. log2 enrichment levels were normalized to reads per genome coverage. Read counts per gene were summed in 50-nt bins.
