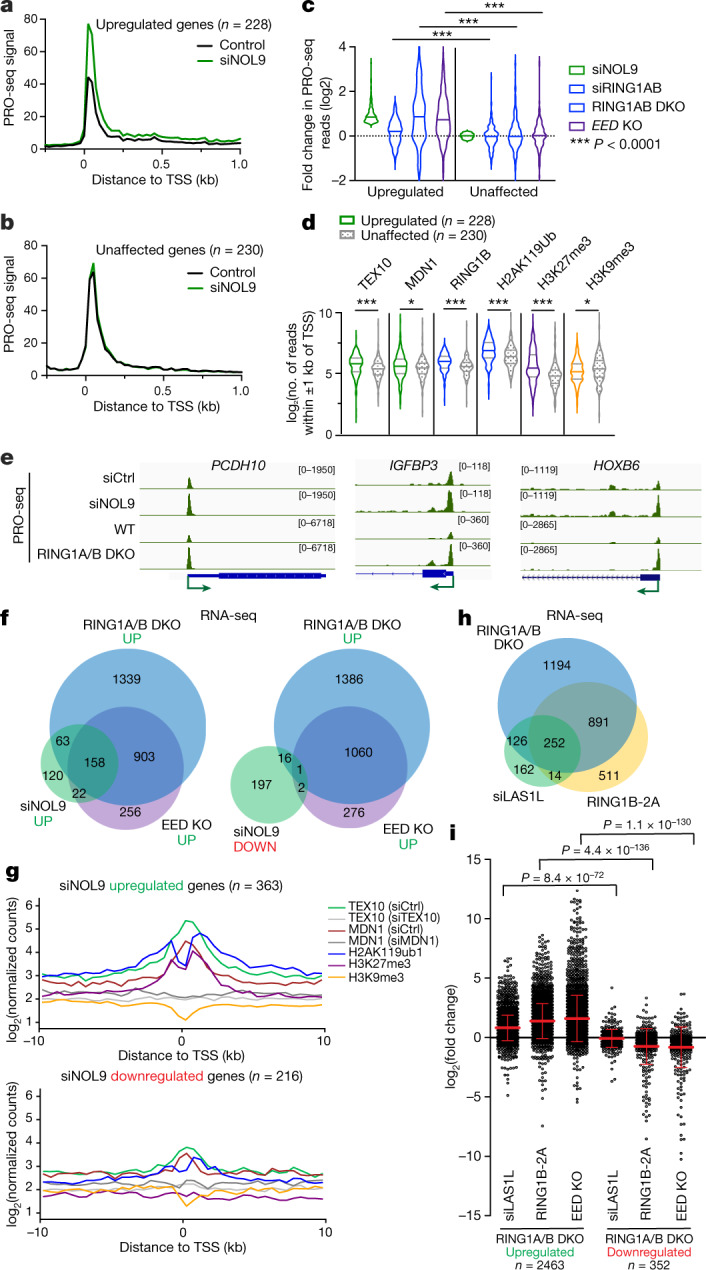
Fig. 4. Loss of rixosome upregulates Polycomb target genes at the level of nascent RNA synthesis.

a, Average distribution of PRO-seq signal is shown at genes upregulated by siNOL9 (n = 228). Data are shown in 25-nt bins. b, Average distribution of PRO-seq signal is shown at expression-matched genes unaffected by siNOL9 (n = 230). Data are shown in 25-nt bins. c, Violin plots depict the log2 fold change in PRO-seq for siNOL9 upregulated (n = 228) and unaffected (n = 30) genes in cells treated with siNOL9, siRING1B and RING1AB-DKO and EED-KO cells. Knockout cells were treated with control siRNA. P values are from two-tailed Mann–Whitney tests. P = 1.45 × 10⁻⁵ for siRING1AB, P = 1.98 × 10⁻¹⁷ for RING1AB-DKO and P = 3.39 × 10⁻²⁴ for EED-KO. d, Violin plots showing read counts for the indicated ChIP–seq experiments. Reads were summed ±1 kb from the TSS for the gene groups indicated. Violin plots depict the range of values, with the centre line indicating the median. P values are from two-tailed Mann–Whitney tests. P = 1.55 × 10⁻⁷ for TEX10, P = 0.0178 for MDN1, P = 3.74 × 10⁻¹⁰ for RING1B, P = 2.34 × 10⁻⁸ for H2AK119ub1, P = 1.76 × 10⁻¹¹ for H3K27me3 and P = 0.0321 for H3K9me3. e, Genome snapshots of PRO-seq experiments showing transcribing PolII at the indicated genes in siCtrl, siNOL9 and RING1A/B-DKO HEK 293FT cells. f, Venn diagrams showing overlap among upregulated (left) and downregulated (right) genes in cells treated with siNOL9 with upregulated genes in EED-KO and RING1A/B-DKO cells in RNA-seq experiments. Hypergeometric probability P values: siNOL9 upregulated versus RING1A/B-DKO, 3.1 × 10−122; siNOL9 upregulated versus EED-KO, 3.6 × 10−125; siNOL9 downregulated versus RING1A/B-DKO, 0.1; siNOL9 downregulated versus EED-KO, 1.2 × 10⁻³; RING1A/B-DKO versus EED-KO, 4.2 × 10−854. g, Average distribution of normalized log2 counts of the indicated ChIP–seq reads for genes that are upregulated (top) or downregulated (bottom) in HEK 293FT cells treated with siNOL9. Enrichment levels were normalized with reads per genome coverage. Read counts per gene were summed in 50-nt bins. h, Venn diagram showing overlap among upregulated genes in RING1B-2A, siLAS1L and RING1A/B-DKO cells in RNA-seq experiments; 1,143 genes (69%) were upregulated in both RING1B-2A-expressing and RING1A/B-DKO cells; 437 genes (79%) were overexpressed in both siLAS1L-treated and RING1A/B-DKO cells. Hypergeometric probability P values: RING1B-2A versus RING1A/B-DKO, 1.2 × 10−805; siLAS1L upregulated versus RING1A/B-DKO, 2.2 × 10−239; siLAS1L upregulated versus RING1B-2A, 8.2 × 10−157. i, Dot plots showing changes in gene expression detected by RNA-seq of RING1B-2A cells, siLAS1L-treated cells and EED-KO cells in the sets of genes that are upregulated or downregulated in RING1A/B-DKO HEK 293FT cells. Data are mean ± s.e.m. P value is from the two-tailed Mann–Whitney test.
