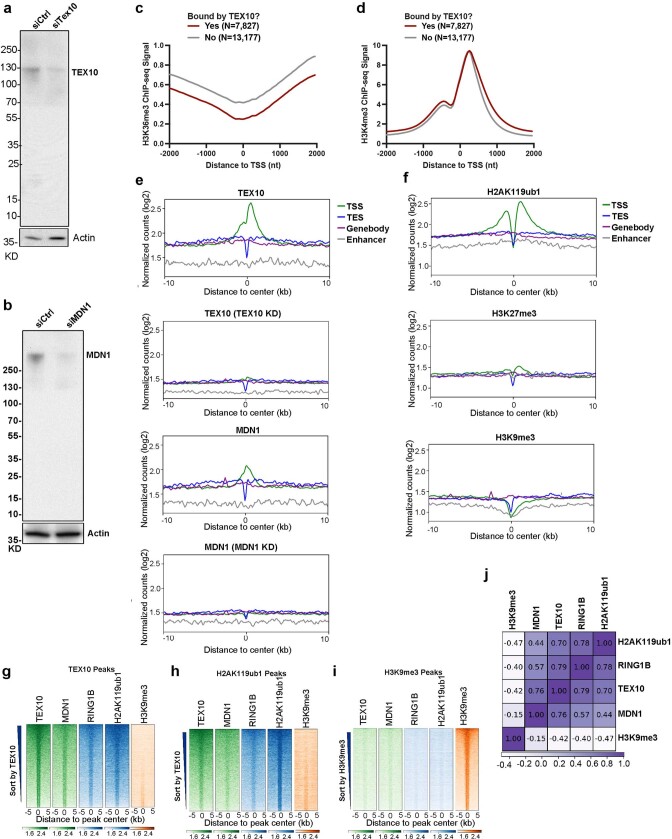
Extended Data Fig. 2. The rixosome is preferentially enriched at promoter regions.
a, b, Immunoblot validation of siRNA-mediated TEX10 (a) and MDN1 (b) knockdowns. c, d, Average distribution of the indicated ChIP-seq reads at the TEX10-bound genes (n = 7,827) versus TEX-10-unbound genes (n = 13,177). Read counts per gene were averaged in 50-nt bins, using summed reads in the window +/−1kb from TSS. e, Average distribution of TEX10 and MDN1 ChIP-seq signal is shown relative to all annotated (hg19) transcription start sites (TSS), transcription termination sites (TES), gene bodies, and enhancers. Enrichment levels (log2) were normalized with Reads Per Genome Coverage. Read counts per gene were summed in 50-nt bins. f, Average distribution of H2AK119ub1, H3K27me3, and H3K9me3 ChIP-seq signal is shown relative to all annotated (hg19) transcription start sites (TSS), transcription termination sites (TES), gene bodies, and enhancers. Enrichment levels (log2) were normalized with Reads Per Genome Coverage. Read counts per gene were summed in 50-nt bins. g, Heatmap representations of ChIP-seq of TEX10, MDN1, RING1B and histone modifications H2AK119ub1 and H3K9me3 at TEX10 peak regions. Rank order is from most to least TEX10 signal. Enrichment levels (log2) were normalized with Reads Per Genome Coverage. Read counts per peak region were summed in 50-nt bins. h, Heatmap representations of ChIP-seq of TEX10, MDN1, RING1B and histone modifications H2AK119ub1 and H3K9me3 at H2AK119ub1 peak regions. Rank order is from most to least TEX10 signal. Enrichment levels (log2) were normalized with Reads Per Genome Coverage. Read counts per peak region were summed in 50-nt bins. i, Heatmap representations of ChIP-seq of TEX10, MDN1, RING1B and histone modifications H2AK119ub1 and H3K9me3 at H3K9me3 peak regions. Rank order is from most to least H3K9me3 signal. Enrichment levels (log2) were normalized with Reads Per Genome Coverage. Read counts per peak region were summed in 50-nt bins. j, Matrix depicting Spearman correlation coefficients between ChIP-seq datasets in HEK293 cells, calculated using read counts in all the genomic loci from e–g.

