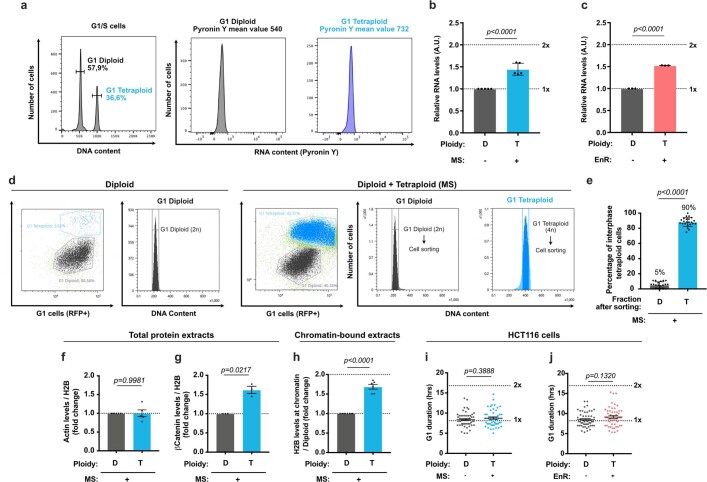
Extended Data Fig. 8. DNA damage analysis in 3D cultures.
(a) Left panel - Representative cell cycle distribution of diploid and tetraploid RPE-1 cells. Right panels - RNA content in diploid (in gray) and tetraploid (in blue) populations. (b, c) Graphs showing the relative RNA levels in diploid (D, in gray) and tetraploid (T) cells generated through MS (b, blue) or EnR (c, red). (d) Representative images of cell sorting experiments according to cell cycle stage (RFP+ for G1 cells) and DNA content. (e) Graph showing the percentage of interphase tetraploid cells in diploid (gray) and tetraploid (blue) RPE-1 cell populations obtained after cell sorting. Mean ± SEM, > 100 interphase cells from at least three independent experiments were analyzed. (f, g) Graphs representing actin (f) and β-Catenin (g) levels relative to H2B levels (fold change) in total protein extracts from diploid (gray) and tetraploid (blue) cells. Mean ± SEM from at least three independent experiments. (h) Graph showing H2B levels in the chromatin bound fraction in diploid (gray) and tetraploid (blue) cells. Mean ± SEM from at least three independent experiments. (i, j) Graph representing G1 duration in diploid (gray) or tetraploid cells generated through MS (i, blue) or EnR (j, red). The dotted lines indicate the nuclear area. The white squares correspond to higher magnification. t-test (one-sided) (b, c, e, f, g, h, i and j).

