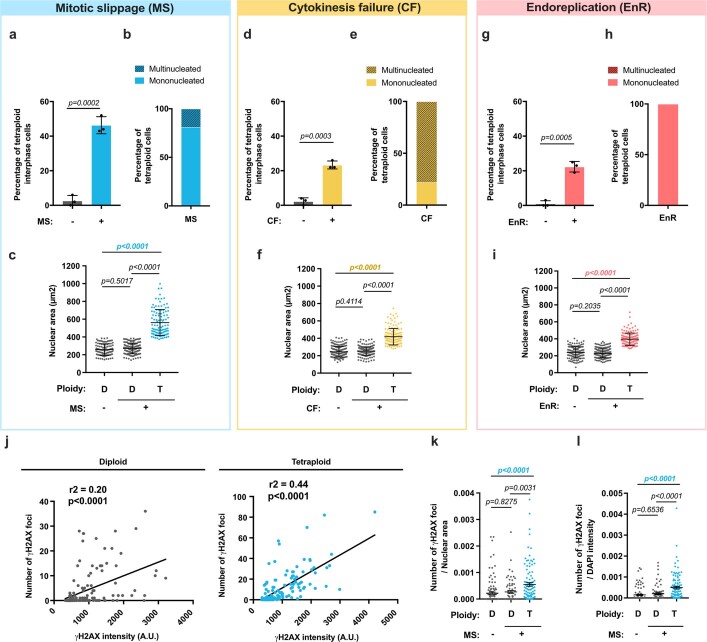
Extended Data Fig. 1. Characterization of RPE-1 cells upon WGD.
(a, d and g) Graphs showing the percentage of tetraploid interphase RPE-1 cells in the indicated experimental conditions. Mean ± SEM, > 100 interphase cells were analyzed from three independent experiments. (b, e and h) Graphs showing the percentage of mono- and multinucleated RPE-1 tetraploid cells in the indicated experimental conditions. Mean ± SEM, > 100 interphase cells were analyzed from three independent experiments. (c, f and i) Graphs representing the nuclear area in diploid (D) and tetraploid (T) RPE-1 cells. Mean ± SEM, >100 interphase cells were analyzed from three independent experiments. (j) Graph showing the correlation between the number of γH2AX foci and γH2AX foci intensity in diploid (left panel, gray) and tetraploid (right panel, blue) RPE-1 cells induced through MS. >100 interphase cells were analyzed from three independent experiments. (k–l) Graphs showing the number of γH2AX foci relative to nuclear area (k) or DAPI fluorescence intensity (FI) (l) in diploid (gray) and tetraploid (blue) RPE-1 cells induced through MS. t-test (two-sided) (a, d and g). ANOVA test (one-sided) (c, f, i, k and l). Pearson test (two-sided) (j).

